The Impact of Tool Qualification on Cycle Time
The reason why tool qualification has a major impact on fab cycle time, with concrete suggestions for mitigating the problem.

Introduction
Something that we’ve long discussed with our customers is the impact of single-path operations on cycle time. While it’s well known across the industry that single-path operations (whether from one-of-a-kind tools or from process restrictions) increase cycle time, the magnitude of that impact is not always well understood. Although fabs may not have much day-to-day control over the number of true one-of-a-kind tools, tool qualification changes can yield immediate, significant benefits.
Background
First, a few definitions, to make sure we are all on the same page:
- One-of-a-Kind Tool:
A tool group that contains only one tool. Also sometimes called a “single tool.” - Tool Qualification:
The process by which a tool is “qualified” to run a recipe or operation. Often one tool is initially qualified to run a new operation. Additional tools are qualified over time to run that operation, if available. - Tool Dedication:
Restriction of an individual recipe or operation to a certain tool, or small set of tools, rather than allowing the recipe to run on any of the tools in a tool group. Also called “process restriction.” Dedicated tools are a consequence of tool qualification practices. They can also arise over time if process restrictions are added or as a result of layout or operations choices (e.g. attempts to minimize setups). - Single-Path Operation:
A recipe or operation that can only be processed on one specific tool. This can occur because the tool is a one-of-a-kind tool, or because of tool dedication or qualification policies.
Tool qualification is a necessary practice in wafer fabs, where technology changes rapidly. It is important for yield management to ensure that new recipes can be run safely on individual tools. Process restrictions are sometimes put in place later, too, in response to yield issues. In some cases, the tools in a tool group are not identical. Newer tools may be able to process recipes that are a problem on the older tools. There are, in short, valid reasons that lead to tool dedication.
The problem is that tool dedication results in smaller tool groups, sometimes with less balanced utilizations. In the presence of variability (which is inevitable in fabs), smaller tool groups result in higher cycle times. This is because lots that are passing through a single tool are at the mercy of all the variability of the lots ahead of them. This is the same dynamic we all see on the highway. On a single lane road, even if overall traffic is light, if we end up behind a slow truck, we will be stuck there for a while. In light traffic on a two-lane road, we can almost always get by the truck quickly.
Queueing Approximations: FabTime Operating Curve Generator
Queueing models, where available, allow us to predict long-run average behavior of systems. Because they don’t require simulation, they can be coded into spreadsheets as formulas. We have included an approximation for average queue time through a tool group as a function of the number of tools in a spreadsheet tool that we developed for our cycle time management course called the FabTime Operating Curve Generator:
Results are for a tool group with a general – possibly batch – arrival process, general distribution of the process times, multiple tools, and one failure distribution. This approximation came from a formula that was originally given to us by Ottmar Gihr of IBM Germany, when we worked with him on the SEMATECH Measurement and Improvement of Manufacturing Capacity (MIMAC) project back in the mid-1990s. We later modified the calculation of coefficient of variation used in the approximation slightly, to follow a formula listed in the text Factory Physics (equation 8.28 in the Second Edition), by W. J. Hopp and M. L. Spearman.
The idea behind this spreadsheet tool is to use queueing models to demonstrate the impact of changes in various factors on the operating curve for a tool group. Participants use the tool extensively during our cycle time management class.
The Operating Curve spreadsheet allows you enter data for up to three scenarios. You can look at:
- Impact of utilization on cycle time
- Impact of variability (in process time, time between arrivals, arriving batch size, and repair time) on cycle time
- Impact of front-of-the-line hot lots on the cycle time of regular lots
- Impact of preventive maintenance strategies on cycle time (short/frequent PMs vs. longer/less frequent PMs)
- Impact of batch arrivals on cycle time
- Impact of tool dedication / qualification decisions on cycle time
There are a few limitations to the tool:
- The spreadsheet has no capability to look at the operating curve of batch processing tools.
- The models use a Priority-FIFO dispatch rule.
- Each operating curve generated is for a tool group in isolation (except for allowing you to look at the variability of the arrivals to the tool group. You can’t use it to look at the fab as a whole.
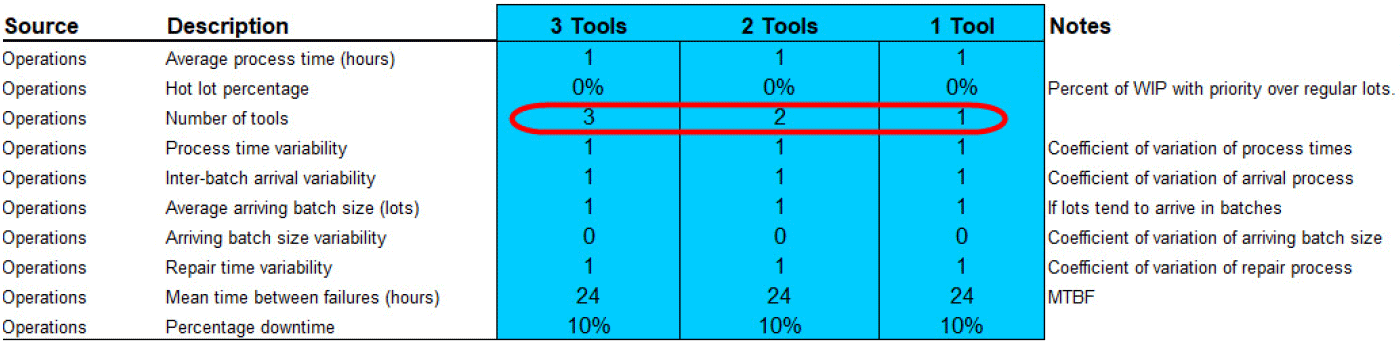
Inputs for the spreadsheet are shown below as Figure 1. We have found this tool to be quite useful for building intuition about operating practices (and the magnitude of the impacts of variability and utilization) on cycle time.
FabTime Operating Curve Generator
Calculates regular lot (non-hot-lot) cycle time for multiple-tool machine groups with general arrival and service processes. Each tool has a single failure process, indicated by MTBF and percentage downtime.

Using the Operating Curve Generator to Explore Qualification Decisions
Back to today’s topic, let’s use the operating curve generator to look at the impact of tool qualification on cycle time for a tool group.
Here the input that we are going to vary (shown circled in red in the image above) is number of tools. Apart from that we will include a moderate level of variability – exponentially distributed arrivals and process times, and 10% downtime, with the repair time also exponentially distributed and a 24 hour mean time between failures. We have not included any hot lots or batch arrivals in this scenario.
The resulting operating curve looks like the image below (Figure 2). It’s important to note that we are looking at tool qualification here and not at purchasing additional tools. What we’re comparing is having a single tool qualified to run a set of lots (the red curve), vs. having two qualified tools and twice the number of lots run on them (the green curve), vs. having three qualified tools and three times the number of lots. We can then compare the curves at the same utilization value. If we wanted to look at adding a second tool to a one-of-a-kind tool, we would expect a reduction in the utilization and thus an even greater impact on cycle time.
Figure 2

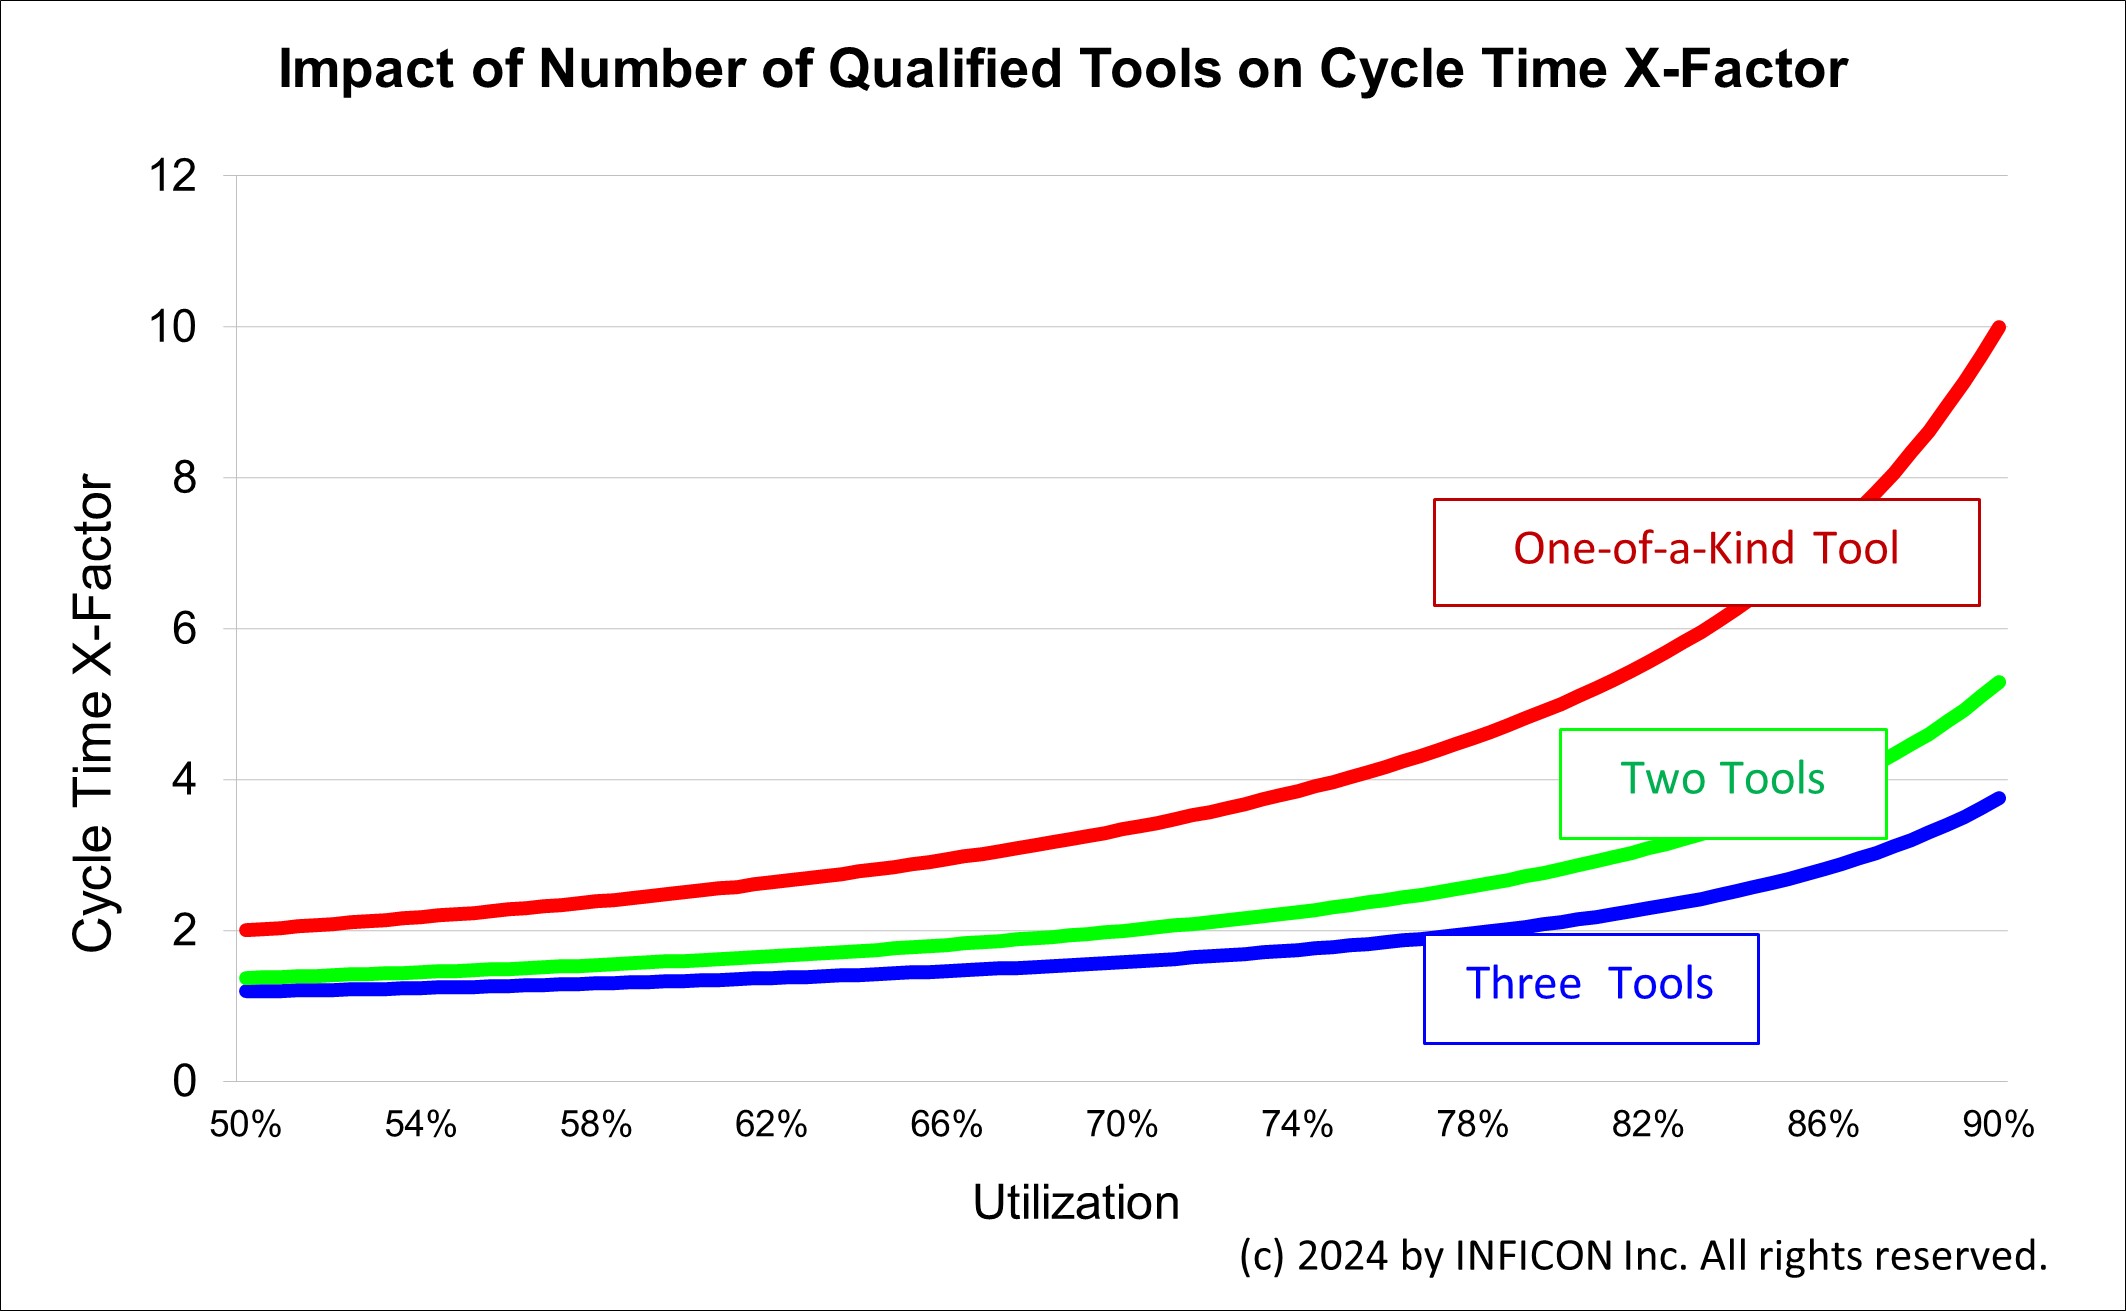
What we think is most significant about this chart is the magnitude of the reduction as we go from the red curve to the green curve (and to a lesser extent to the blue curve). It’s clear visually that the cycle time x-factor through the tool group is cut roughly in half as we go from single-path to having a second qualified tool. The reduction as we go to three qualified tools is less, but still significant at higher utilizations.
This relative reduction is robust to changes in the other variables. The reason for that is the way that the number of tools appears in a portion of the queueing formulas. Other factors are multiplied by this factor, shown in Figure 3.
Portion of the Queueing Formula Showing Impact of Number of Tools


A page on the spreadsheet tool called Impact of Tool Qual allows you to explore this in more detail. Coding just that part of the equation into the spreadsheet and varying the utilization gives the results shown below in Figure 4.
Figure 4. X-Factor Impact of Varying the Number of Tools at Different Utilizations
| Tools | 1 | 2 | 3 | CT Reduction of single-path to dual-path | CT Reduction of single-path to 3 tools |
| Util | Basic XF | Basic XF | Basic XF | ||
| 50% | 2.00 | 1.37 | 1.19 | 32% | 41% |
| 55% | 2.22 | 1.47 | 1.25 | 34% | 44% |
| 60% | 2.50 | 1.60 | 1.33 | 36% | 47% |
| 65% | 2.86 | 1.77 | 1.43 | 38% | 50% |
| 70% | 3.33 | 1.99 | 1.58 | 40% | 53% |
| 75% | 4.00 | 2.32 | 1.79 | 42% | 55% |
| 80% | 5.00 | 2.81 | 2.11 | 44% | 58% |
| 85% | 6.67 | 3.63 | 2.65 | 45% | 60% |
| 90% | 10.00 | 5.29 | 3.75 | 47% | 63% |
X-Factor impact of dual-path is smaller at lower utilization but rises to approximately 50% reduction at 90% utilization.
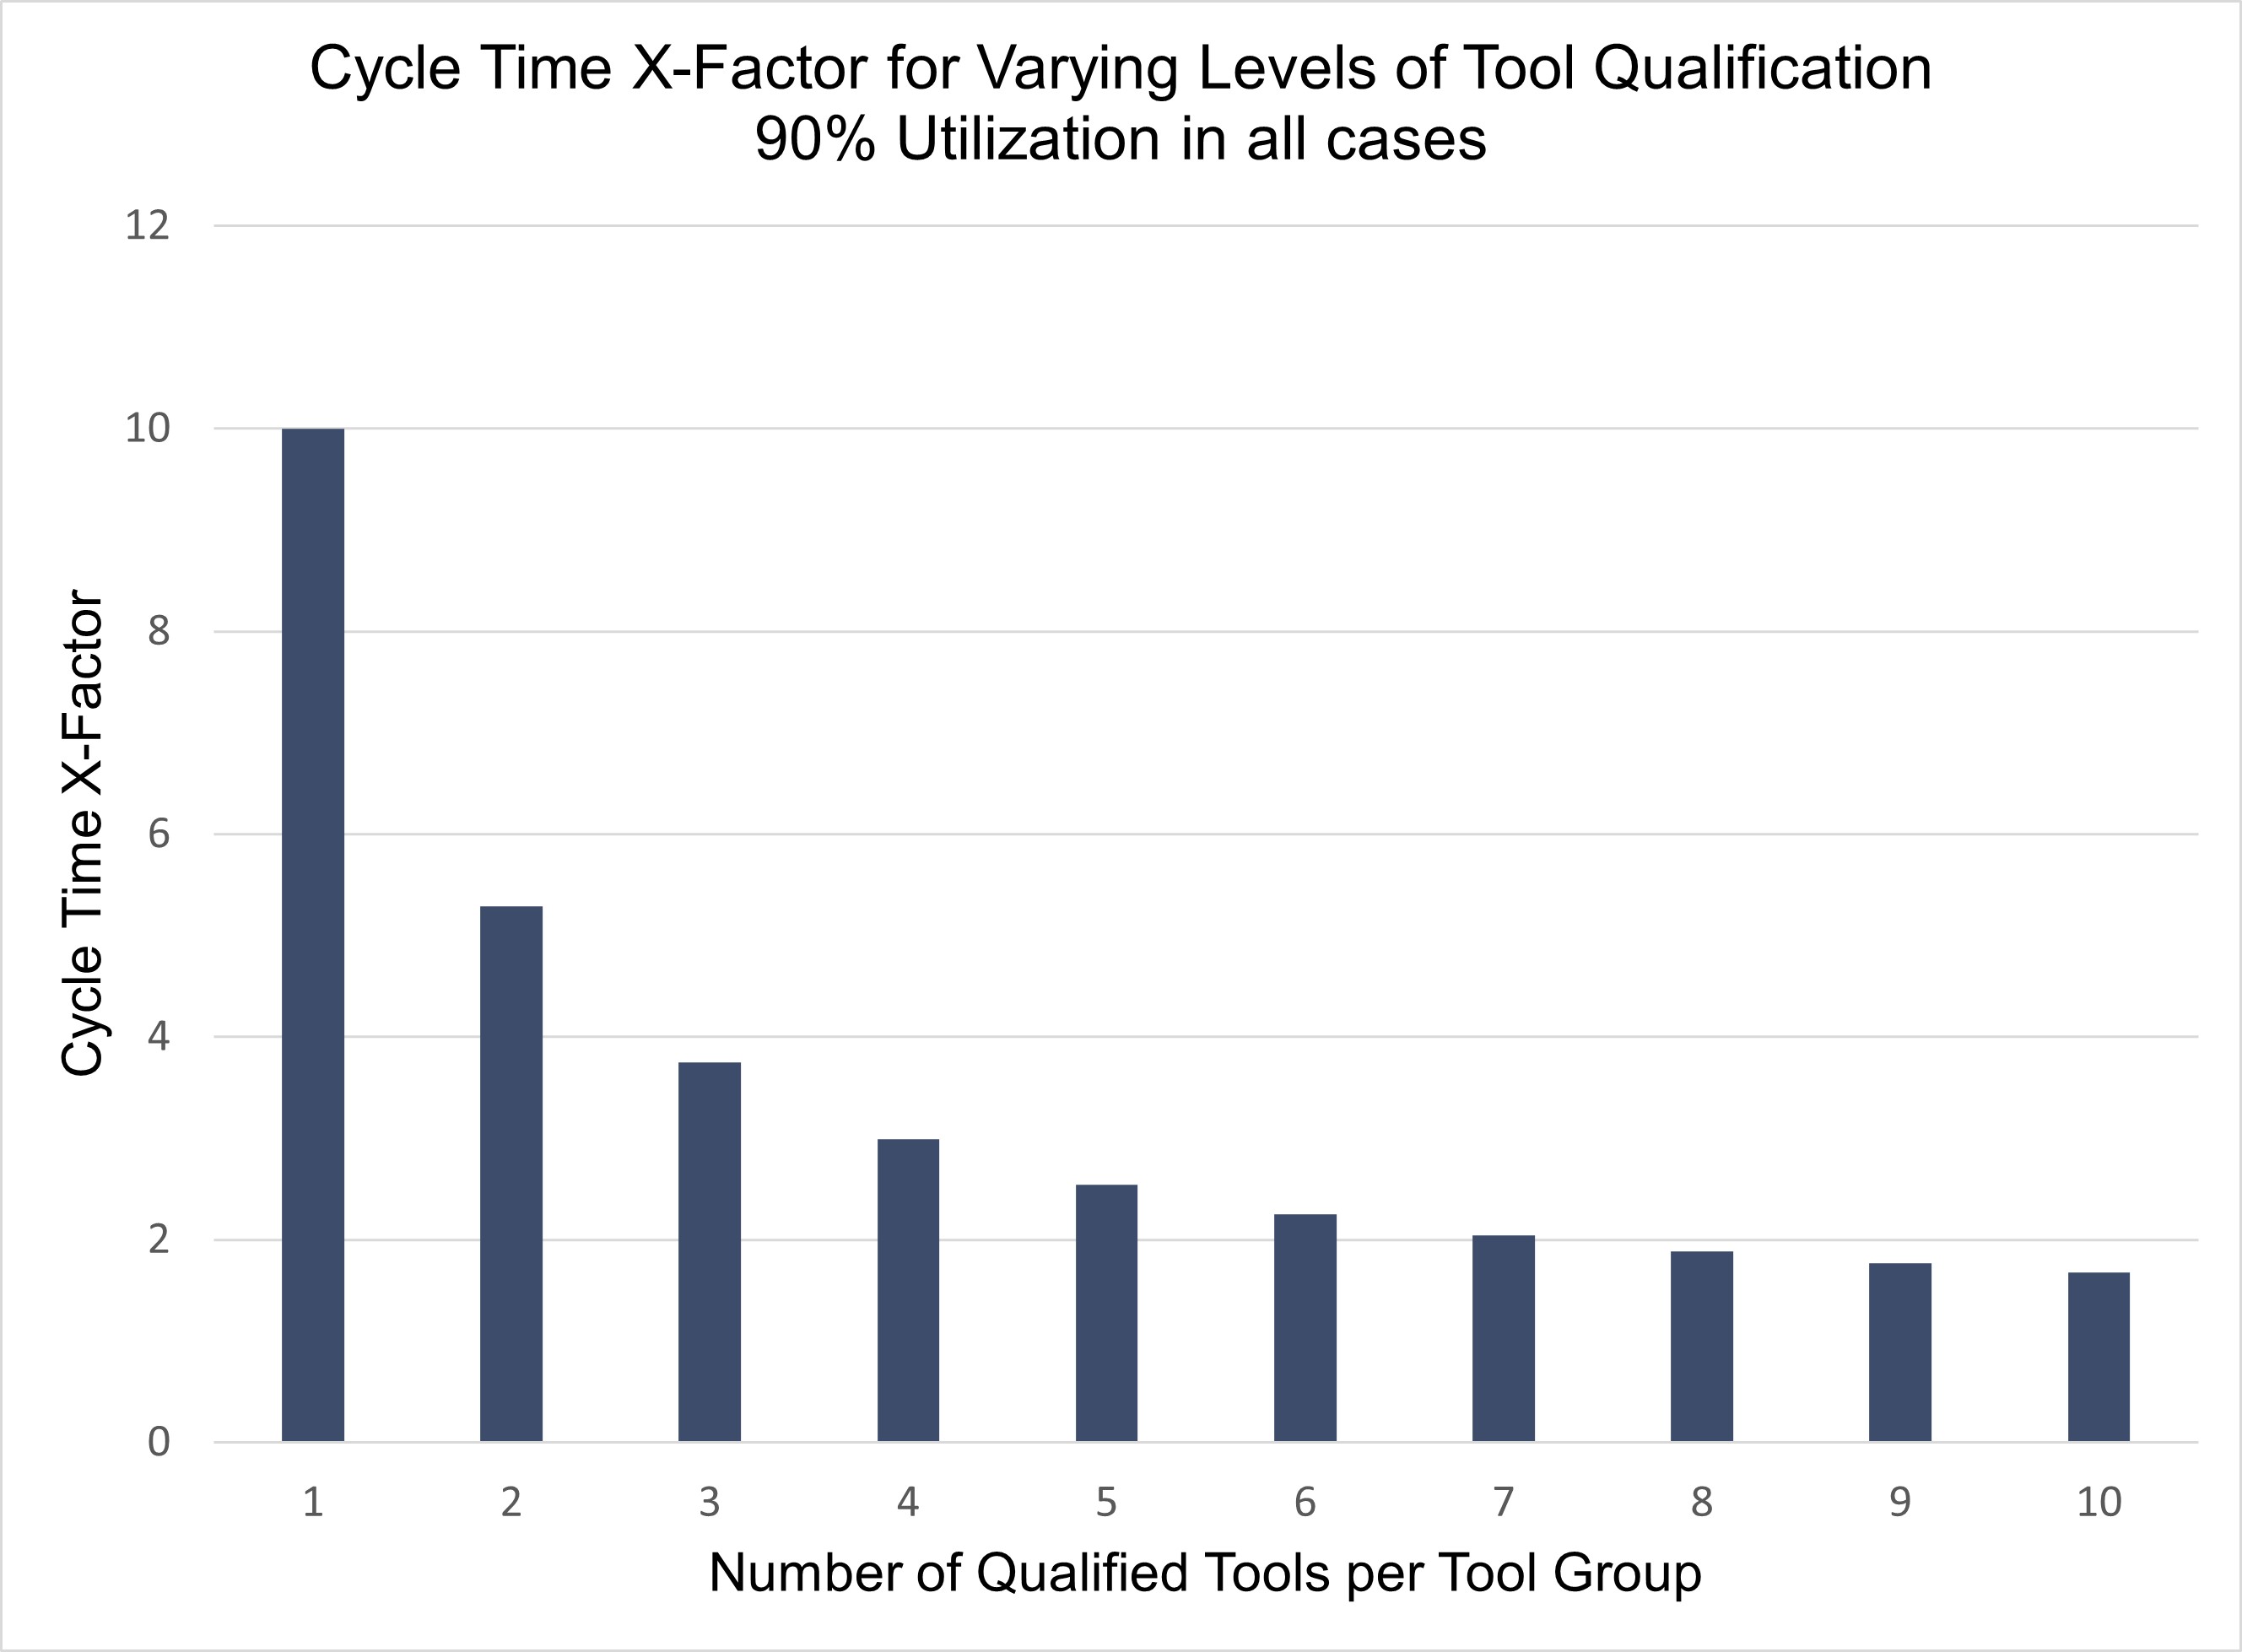
We’ve done a similar analysis to display the impact of qualifying from one tool up to ten tools at 90% utilization, as shown in Figure 5.
Here we again see about a 50% decrease in cycle time as we go from single-path to dual-path, a smaller but still significant reduction as we go to three tools, and smaller and smaller decreases as additional tools are qualified.
Figure 5


An Intuitive Explanation
In the example above, the decrease in queue time is quite dramatic as the number of tools increases. Once there are 10 tools in the tool group, the queue time is small, even though the tools are all loaded to 90% of capacity. Think about it this way. When you have a group with 10 tools, each loaded to 90% of capacity, each tool is going to be idle 10% of the time (neglecting downtime). If arrival times and process times are highly random, then much of the time, when a lot arrives, at least one tool will be idle and ready to process that lot. By contrast, if you only have one tool in a group, and lots can arrive any time, 90% of the time, when a lot arrives, the tool will be busy, and the lot will have to wait.
Examples in Everyday Life
The obvious example that comes to mind here is the grocery store. If instead of having 10 separate checkout lines your grocery store was configured to have a single line for all 10 cash registers, your average waiting time would decrease dramatically. This is because you would never be waiting in line for one cash register, while another one down the line became free. You would never be stuck immediately behind the person who requires a price check, or has never used a credit card before, because you would get the next available register. However, the day of having a single line at the grocery store is not likely to come any time soon. Grocery stores probably use separate lines because of space constraints (the carts are very large).
A Rule of Thumb
All of this leads to our rule of thumb for tool qualification: any time you can get a second tool qualified, to go from single-path to dual-path, for a relatively heavily loaded tool, you can expect a cycle time reduction of about 50%. Getting to three tools will reduce cycle time even further (more than 60% total from the original single-path).
This is not to say that there aren’t yield benefits to single-path. But we believe strongly that those benefits should be considered in light of the impact on cycle time, which is sometimes underestimated.
Soft Constraints
One other point about tool dedication is that “soft constraints” can also arise. Soft constraints are places where tools are dedicated in practice, even if there is such official restriction. This can happen due to layout issues (where a tool group is broken up across the fab), setup minimization policies, or operator preferences for tools. Such soft dedication may make sense in many cases, but when it leads to single-path operations, it can be a hidden source of cycle time in the fab. One way to identify these types of tool preferences is to graph moves and availability by tool on the same chart and look for places where moves are low, despite high availability.
Recommendations
Here are a few recommendations for mitigating the impact of single-path operations in practice:
- Educate process engineers about the magnitude of the cycle time benefits from cross-qualification. Promote standards for getting to at least dual-path.
- Develop reports that generate lists of operations that have only one qualified tool (or no qualified tools, as can also happen). FabTime has a standard chart like this, but it is only as good as the tool qualification data that is entered into the MES.
- Provide automatic warnings when a new process restriction is going to result in single-path.
- Provide warnings when a long PM is going to lead to single-path (or no path). Consider breaking up PMs on key tools that lack redundancy. Similar rules may apply to times when engineers take over tools to run experiments.
- Check periodically for soft constraints.
Conclusions
One of the three fundamental drivers of cycle time in a factory is the level of tool redundancy. At the tool group level, number of tools has a significant impact on cycle time. This impact accumulates across the fab. It is the primary reason why smaller fabs that have many one-of-a-kind tools tend to have higher average cycle time than larger fabs.
The number of one-of-a-kind tools is not something that fabs can easily change on a day-to-day basis. However, something that fabs can change is their tool qualification policies. When tool qualification policies result in single-path operations, they drive up cycle times significantly. Often the cycle time through a single-path operation is twice what it would be if a second path was provided.
In this article, we share a spreadsheet tool that allows companies to use queueing approximations to explore tradeoffs in tool qualification policies. We hope that this tool will be of use in conveying to team members the importance of providing and maintaining backup tools.
