A New Metric for the Functional Utilization that Drives Cycle Time
Captures the portion of utilization that drives cycle time at the tool level by distinguishing between standby time with WIP waiting and standby time when no WIP is waiting.

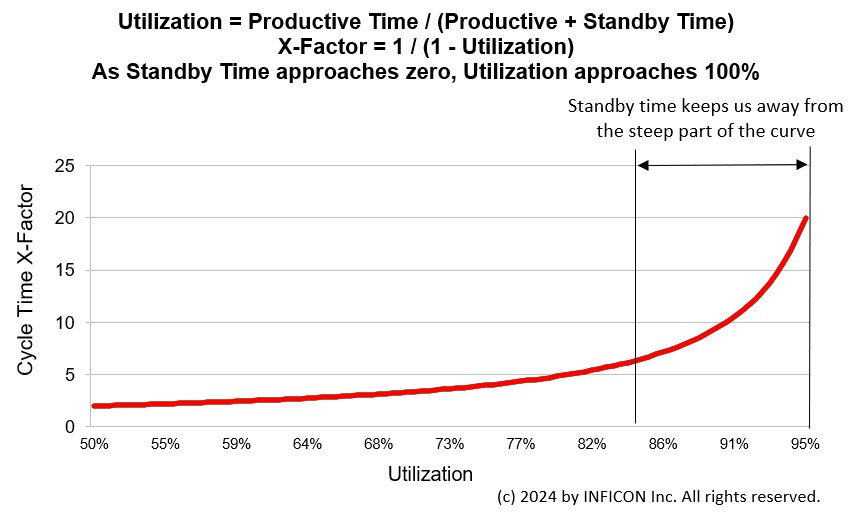
Though there are several different definitions of utilization, Manufacturing Utilization, tracked as Productive Time / (Productive + Standby Time), is a primary driver of cycle time at the tool group level. Tool groups need to have some standby time as a buffer against the variability that is endemic in wafer fabs. Without that standby time, utilization rises close to 100%, and cycle time becomes unacceptably high, as shown in the operating curve below.

It is our belief, however, that this definition of manufacturing utilization is not always sufficient to capture the impact of standby time on cycle time. In this article, we propose a supplemental utilization metric that differentiates between standby time when there is no WIP waiting (which is helpful for cycle time) and standby time when there is WIP waiting (which is detrimental for cycle time). We are calling this new metric Functional Utilization.
Manufacturing utilization is a commonly used metric to track tool performance, one of several definitions of utilization
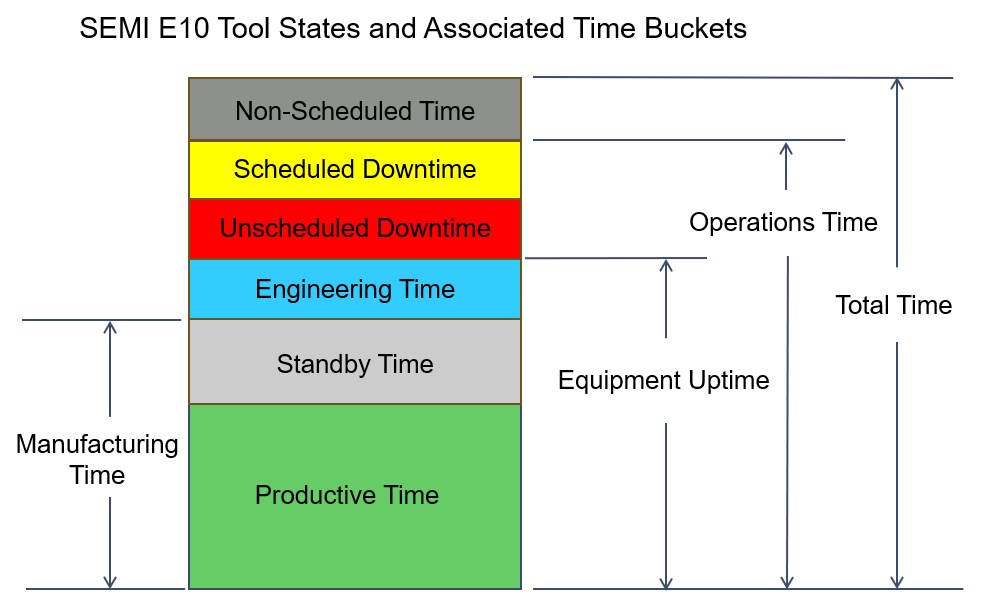
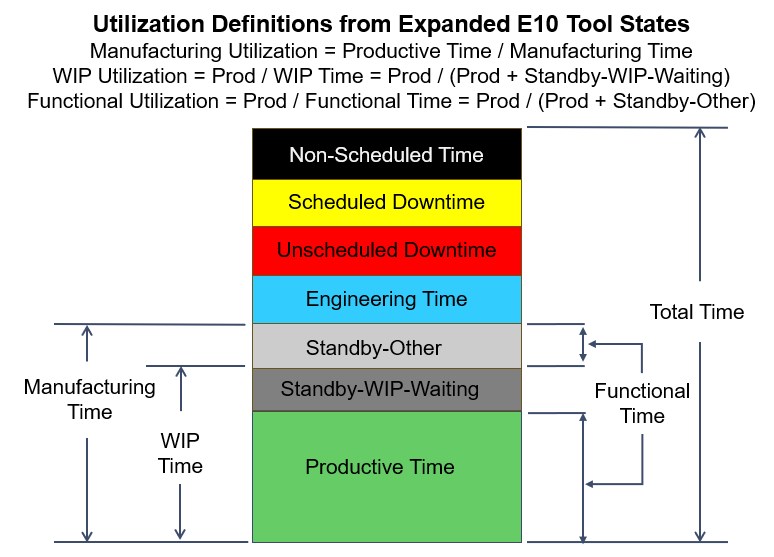
The FabTime and FPS Digital Twins historically included various definitions of tool utilization, each based on the percentage of productive time relative to a different, SEMI E10-defined time bucket. SEMI E10 is the SEMI Standard Specification for Definition and Measurement of Equipment Reliability, Availability, and Maintainability (RAM) and Utilization, available for purchase from SEMI’s website. The SEMI-specified E10 tool states and time buckets are shown below. The corresponding utilization definitions are:
- Total Utilization % = Productive Time / Total Time
- Operational Utilization % = Productive Time / Operational Time
- Equipment Uptime Utilization % = Productive Time / Equipment Uptime
- Manufacturing Utilization % = Productive Time / Manufacturing Time
Total utilization and operational utilization are defined in E10 as above. Equipment uptime utilization and manufacturing utilization are not specifically defined in E10, but are consistent with E10 and are widely used in the industry. FabTime has also long used a fifth utilization definition based on the breakdown of the E10 Standby state into two sub-states according to whether WIP is waiting:
- WIP Utilization % = Productive Time / (Productive Time + Standby-WIP-waiting Time)
FabTime previously referred to manufacturing utilization as simply utilization (and will be renaming the utilization metric in FabTime accordingly going forward). The reason that FabTime uses the manufacturing utilization definition is that we have always believed that this is the utilization that drives cycle time.
.")
We don’t recommend targeting 100% manufacturing utilization because some standby time is needed to keep cycle time under control
If we try to run a tool for 100% of the time that it is available to manufacturing on a long-term basis, we will eventually run into trouble. This is because of variability. It is inevitable that at some point we’ll be unable to keep the tool running wafers, maybe even just for a few minutes. There’s no operator to load the tool during shift change. The tool was starved because of a lengthy upstream downtime. We held the tool idle for a hand-carry lot. And so on. If we try to run at 100% utilization of manufacturing time, and we lose a few minutes to variability, we can never make that up. This means that the queue for that tool will keep growing and growing.
Having a buffer of standby time protects us from this variability by giving the tool a chance to recover from these types of events. This is captured in the queueing formulas that we use to estimate x-factor. As has been shown previously (see The Three Fundamental Drivers of Fab Cycle Time), we can estimate x-factor for a one-of-a-kind tool as:
X-Factor = 1 + [(Utilization / (1 – Utilization)) * Variability Factor]
Let’s look at what happens when we substitute for utilization using the definition of manufacturing utilization:
Manufacturing Utilization = Productive Time / (Productive + Standby Time)
Shortening Productive Time to P and Standby Time to S we have:
- Utilization = P/(P+S)
- (1 – Utilization) = [(P+S)/(P+S)] – [P/(P+S)] = S/(P+S)
- X-Factor = 1 + [(P/(P+S))/(S/(P+S))]*Variability Factor = 1 + (P/S)*Variability Factor
That is,
- X-Factor = 1 + (Productive Time*Variability Factor)/Standby Time
This formulation makes it clear that when standby time is zero, we have:
- X-Factor = 1 + (Productive Time * Variability Factor)/0
When we divide by zero, we get infinity. We’ll never have truly infinite cycle time because we don’t have infinite WIP. But we will see cycle time continuing to rise over time if we don’t have any standby time to recover from variability.
[Side Note: It may be possible to run the constraint tool in the fab close to 100% utilization by managing the buffer in front of that tool (so that it never starves), while gating starts into the fab to avoid overloading. This must be done carefully because a) the constraint sometimes shifts over time and b) in the presence of reentrant flow, balancing the WIP level in front of the tool is quite complex.]
In general, the larger the productive time relative to the standby time, at a given level of variability, the higher the cycle time will be. This is why most tools need to have some quantity of standby time to recover from variability (as we’ve been saying in our cycle time class for many years). But this is not the whole story.
Manufacturing utilization doesn’t tell the whole story, because not all standby time is created equal
The above definition of manufacturing utilization conflates two different kinds of standby time. In FabTime these are called standby-WIP-waiting and standby-other. Standby-WIP-waiting is also called “Standby With WIP” (FPS Dashboard) or “Standby when product is available” (the SEMI E79 Specification for Definition and Measurement of Equipment Productivity). Whatever it’s called, it’s time that the tool is available, and has WIP waiting to be processed, but is not being run for some reason. Reasons for standby-WIP-waiting include:
- Lack of Operators: There is no operator there to load the tool.
- Hot Lots: The tool is being held for an expected hand-carry lot.
- Lot Transport: The MES says that WIP is available, but the operators can’t find it.
- Batch Loading Rules: The operator is waiting for more lots before starting a non-full batch.
- Time Constraints: WIP is being held at an upstream step until operators are sure it can make it through a time link loop without violating a constraint. (See Issue 22.02: Managing Time Constraints between Process Steps in Wafer Fabs)
- Setup Minimization Rules: The operator is waiting for another lot with a matching setup ID to avoid doing a setup on the tool.
Standby-other is time that the tool is available to manufacturing and is not being run because there is no WIP there. Standby-other is also called “Standby No WIP.” Reasons for standby-other include:
- Short-Term WIP Fluctuation: The is no WIP at this tool because the WIP has been held up somewhere else (e.g. waiting for a down tool).
- Planned Capacity Buffer: The capacity plan for this tool calls for some percentage of idle time. The size of this buffer will be influenced by tool granularity. We can’t buy 2.6 tools, so we buy three tools. The tool group will have extra idle time unless the mix changes or start rate increases.
It should be noted that the SEMI E10 Specification does not distinguish between these two types of standby time, though it does state that standby time can include periods such as “no operator available.” The E79 Specification does not distinguish between types of standby time for the standard OEE definitions. E79 does, however, include the concept of excluding “No Product Time” from productivity loss as part of a supplemental productivity metric called Production Equipment Efficiency (PEE). Under PEE, Equipment Downtime when no product is available is also excluded.
We believe that standby-WIP-waiting time and standby-other should be tracked separately because they have different impacts on cycle time. Standby-WIP-waiting is essentially a capacity loss. It’s time that the tool could be running wafers, but is not. Standby-other, in contrast, is (for the most part) a buffer that allows us to recover from variability. We normally want to decrease standby-WIP-waiting time, because it represents lost capacity. However, if we want good cycle time, we may want to increase standby-other, at least by enough to keep us away from the steep part of the operating curve.
One other point about standby-WIP-waiting: there is some room for debate about how time is allocated between standby-WIP-waiting and standby-other. Suppose there is one lot waiting, and two tools are available. Should the time be counted as standby-WIP-waiting for both tools, or just one of the tools? If the latter, how do we decide which one? We will defer detailed discussion of these decisions to a future article.
WIP Utilization is a metric for driving Standby-WIP-Waiting time to zero
FabTime worked previously with a customer for our cycle time class to define a metric called WIP Utilization. WIP Utilization was designed to incentivize the manufacturing team to reduce standby-WIP-waiting time. It was defined as:
WIP Utilization = Productive Time / (Productive Time + Standby-WIP-Waiting Time)
The nice thing about WIP utilization is that if we can reduce standby-WIP-waiting time to zero, then WIP utilization will always be 100%. This makes it a cleaner metric for driving improvement than standard manufacturing utilization, where we have “well, keep it below 100%, but don’t let it go too low because that’s not cost-effective.” We always want to drive WIP utilization to 100%.
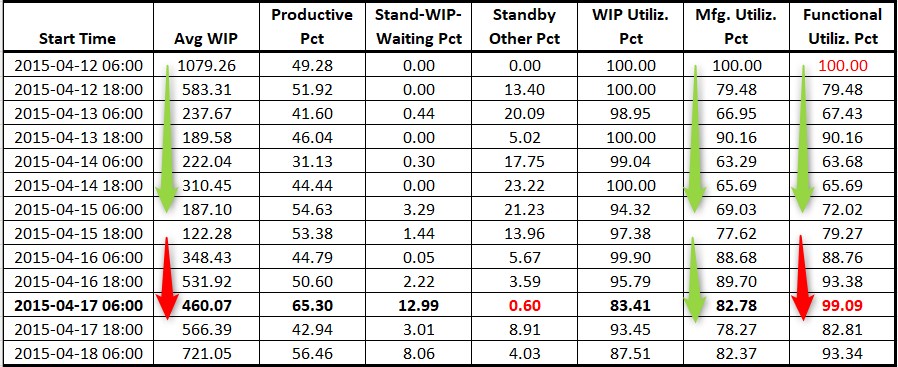
WIP utilization is available on all FabTime Tool State charts. An example is shown below. WIP utilization, the purple line near the top of the chart, is 100% for the first few shifts, because there is no standby-WIP-waiting time. WIP utilization drops later in the week for shifts that have standby-WIP-waiting time (the dark gray on the chart).

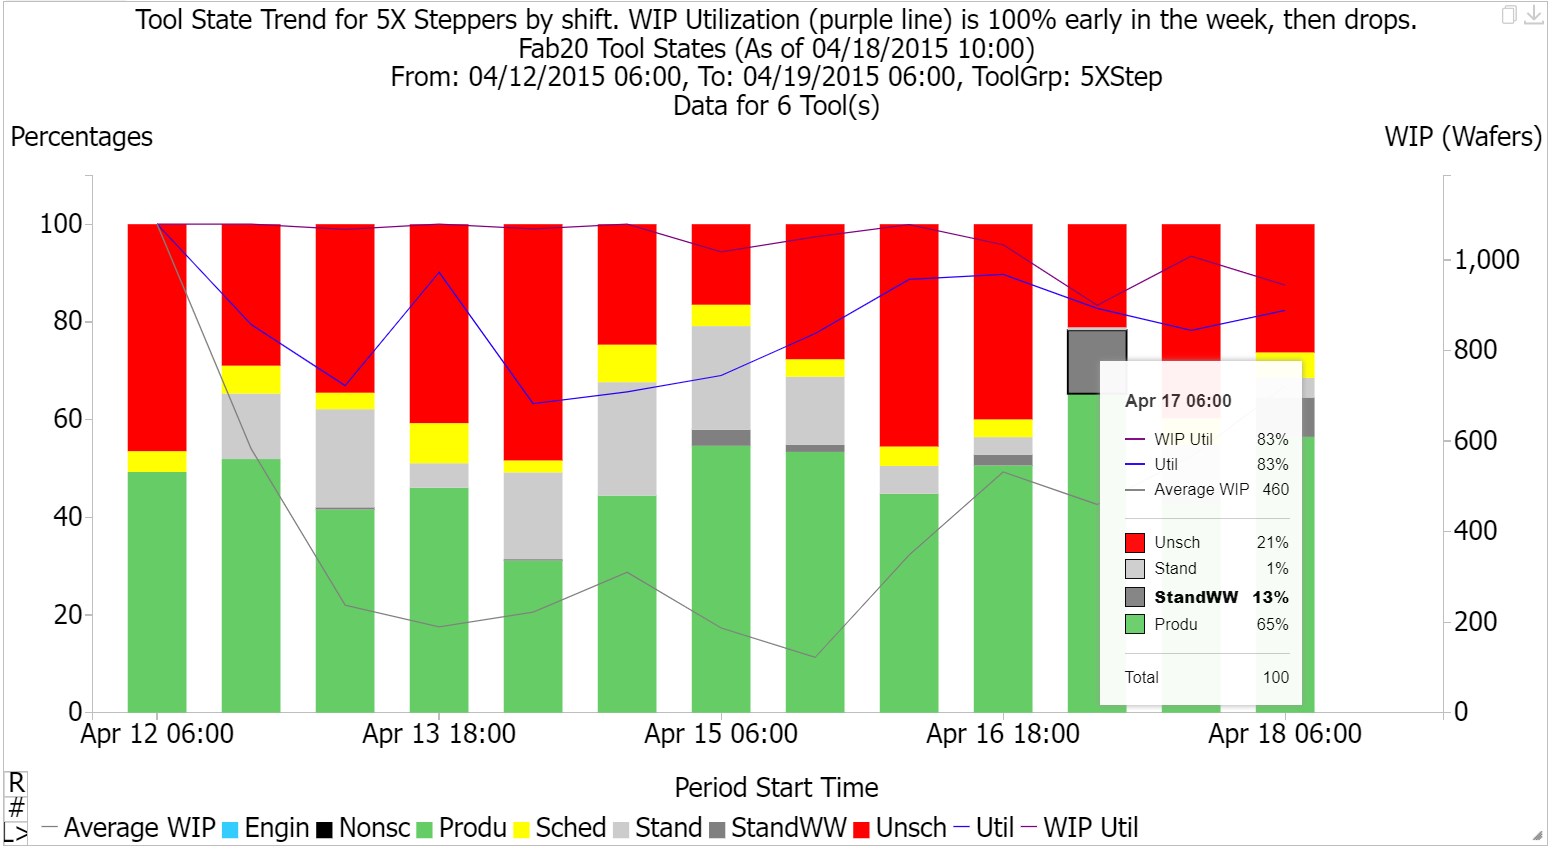
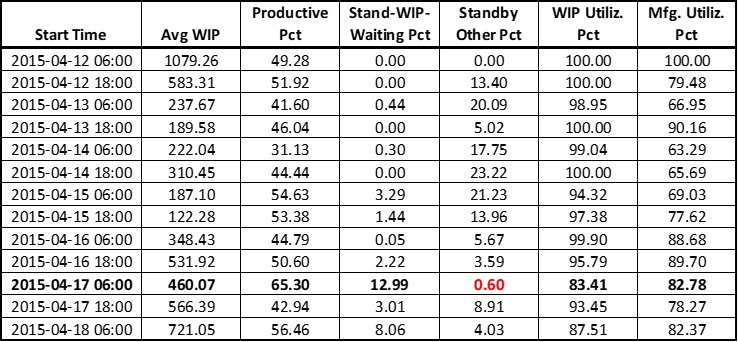
For the April 17th day shift (shown in bold in the table below), nearly all the standby time is standby-WIP-waiting, and the WIP utilization is nearly equal to the manufacturing utilization

Increasing WIP utilization by reducing standby-WIP-waiting time can help with cycle time improvement efforts. In the above example, cycle time per visit would likely have been better on April 17th if that 12.99% standby-WIP-waiting was converted to standby-other. However, WIP utilization alone won’t help us to distinguish between the left-most shift (April 12, 6:00), where there is no standby time, and the next few shifts, where there is standby time. WIP Utilization is high for all those shifts. Notice that the WIP is much higher for the first shift, however, and then decreases over the next few days, as the amount of standby-other time increases from zero.
To understand what cycle time we can expect from a tool group, we need a utilization definition that is based on standby time when no WIP is waiting
We propose a supplemental utilization metric, which we are calling Functional Utilization. This metric is based on productive time relative to the time that the tool is available to manufacturing and not lost to operational issues such as lack of operator availability or holding tools for hot lots. We’ll define:
- Functional Time = Productive Time + Standby-Other
And:
- Functional Utilization = Productive Time / Functional Time
For consistency, we’ll also define:
- WIP Time = Productive Time + Standby-WIP-Waiting Time
And:
- WIP Utilization = Productive Time / WIP Time
This is the same definition used for WIP utilization above. We’ve just added a name for the time bucket that consists of productive time plus standby-WIP-waiting time.
But it’s functional utilization that’s new, and that drives cycle time. When functional utilization is 100%, cycle time will likely be very high for a given tool group.

So how would we use functional utilization?
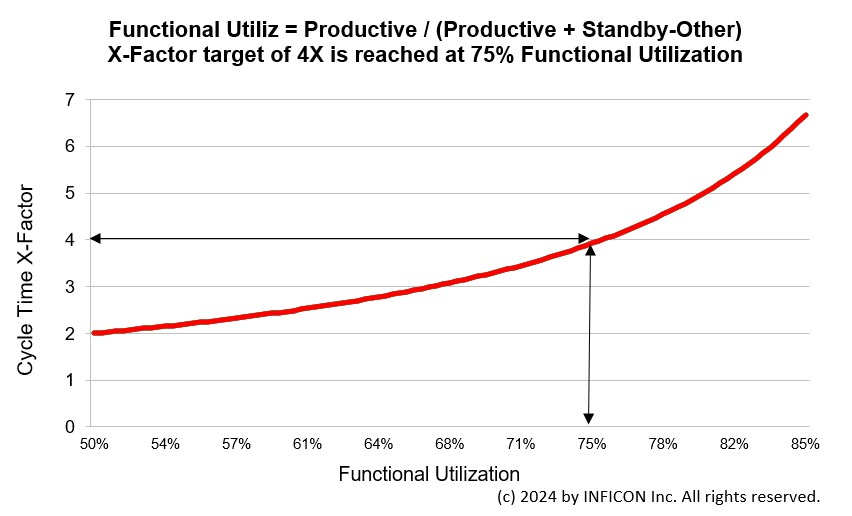
We can use functional utilization as we used manufacturing utilization in queueing formulas. When we do this, we’re treating the standby-WIP-waiting time as a capacity loss, instead of treating it like standby time. We can thus use the FabTime Operating Curve Spreadsheet to set targets for the required functional utilization to reach a given cycle time goal. An example for a one-of-a-kind tool is shown below.

We can also use functional utilization as an overall indicator for how good a cycle time a fab will be likely to achieve. We would expect a high value for functional utilization for the most expensive bottlenecks tools. But if most of the tools in the fab have a functional utilization above 85%, it’s likely that overall cycle times will be high (especially for fabs that lack tool redundancy). If many tool groups in the fab have low values for functional utilization, the fab is unlikely to be cycle time constrained (but may struggle with profitability). It’s possible that increases in average functional utilization across the full fab toolset would correlate with increased cycle time, but we would want to see actual data on this.
We can also compare actual functional utilization over time to the planned utilization for a tool group. If functional utilization is much higher than planned utilization, this suggests that the fab is losing significant capacity due to operational issues or poor availability performance. We’re not getting as much standby time that we can use as a buffer for variability as we expected.
Returning to the Tool State Trend example shown above, in the WIP utilization section, let’s look below at the additional information that functional utilization (right-most column) gives us about expected cycle time.
Here we see that WIP (a proxy for cycle time) is decreasing as functional utilization decreases and increasing as functional utilization increases. Manufacturing utilization follows a similar trend early in the week, but misses the impact of the April 17th morning shift (shown in bold), where the functional utilization rises to 99%.

We likely wouldn’t use functional utilization as a KPI to drive daily performance
Unlike WIP utilization, functional utilization does suffer the problem of lacking a clear target. We don’t want it to be 100% (over the long term, at least), because that means that cycle times will be very high. But we equally don’t want it to be zero, because then we aren’t processing any wafers. In practice, we’d like functional utilization to be as low as possible while still meeting throughput goals.
A good target for functional utilization for non-bottleneck tools that have redundancy is probably 85%. For one-of-a-kind tools, 75% might be better. For true bottleneck tools, the most expensive tools in the fab, we may want to push that functional utilization closer to 90 or 95%. But if we want to improve cycle time, we want to continuously drive those functional utilization numbers down.
All of this makes functional utilization problematic as a primary day-to-day metric. We view it instead as a supplemental metric that we can use to understand why cycle time is higher than anticipated, and to drive cycle time improvement efforts.
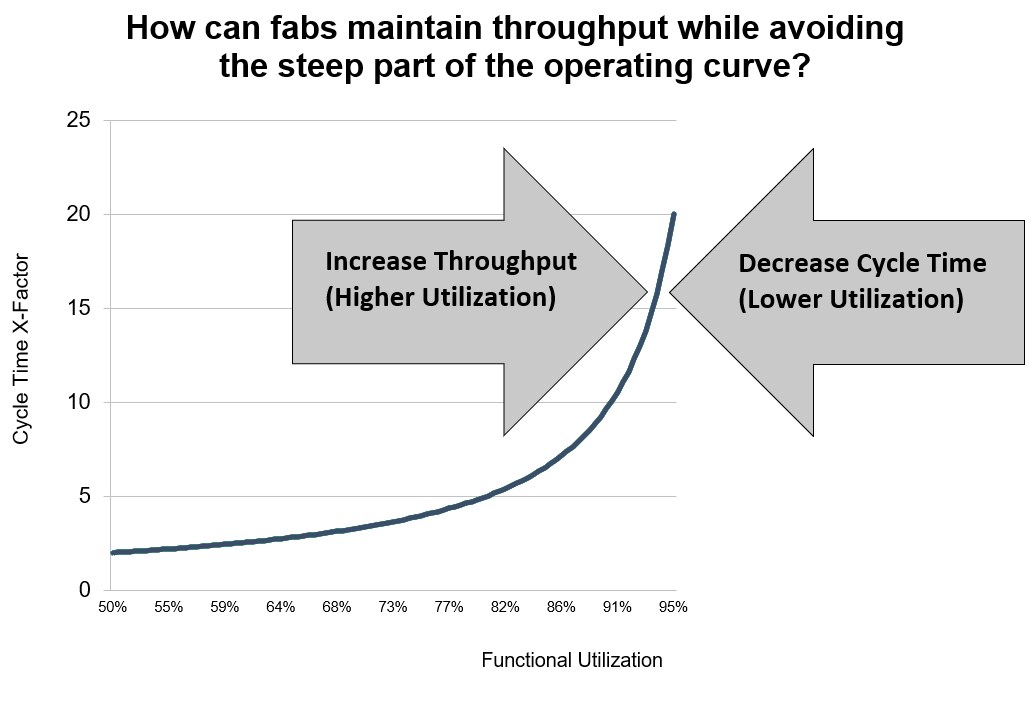
How can we decrease functional utilization (increase the standby time buffer) without sacrificing throughput?
The goal here is to maintain throughput, but convert other losses into standby time when there is no WIP waiting. There are several ways to do this:
Improve equipment uptime by reducing scheduled and especially unscheduled downtime.
Reduce the quantity of engineering time (or at least schedule it to take place when no WIP is waiting).
Reduce standby-WIP-waiting time. Here are a few ideas (most taken from our cycle time management course):
- Cross-train operators and stagger break schedules, to reduce delays due to lack of operators.
- Reduce the number of hot lots, especially hand-carry lots.
- Run batch tools under a greedy policy.
- Ensure that setup avoidance policies only apply when there is WIP with a matching setup ID that is already in queue.
- Use a Smart Scheduler that can handle time constraints between process steps.
Process the same quantity of wafers in a shorter time to reduce productive time by eliminating speed losses and other non-value-added time (e.g. processing rework wafers or waiting for an operator to unload a tool) that gets recorded as productive time. That is, get the same number of wafers through the tool in a smaller amount of productive time.
 while avoiding the steep part of the operating curve (where cycle time increases).")
Isn’t this just OEE?
Not quite. The recommendations in the previous section do tie to OEE loss factors. However, standard OEE does not include a loss factor specific to standby-WIP-waiting time. (Or rather, it includes a loss factor for all standby time, whether WIP is waiting or not.) PEE does have a loss factor for this, but it also only considers downtime a loss if there is WIP waiting. Downtime when there is no WIP waiting is certainly better than downtime with WIP waiting, and PEE incentivizes the maintenance organization to do PMs when no WIP is waiting, which is a good thing. But for cycle time, we’d still rather have that time as standby time than downtime, so that we can use it to recover from variability.
PEE is accounting for time that a tool isn’t busy because there’s no WIP there, and saying “OK, that’s not a loss factor.” But what it isn’t saying is that for optimal cycle time performance we require some time that the tool is in a standby state and has no WIP waiting.
OEE and PEE are important frameworks for working to eliminate capacity losses. PEE extends upon OEE by understanding that there is a difference in standby time depending on whether WIP is waiting. But neither OEE nor PEE is focused specifically on reducing cycle time. To reduce cycle time, we feel that there is benefit in this additional metric of functional utilization, which we try to drive down for cycle time improvement.
Another way to look at this is just to say that from a cycle time perspective, we don’t want standby-other to be driven to zero. Most of the time, at least, we need some positive buffer of standby time, ranging from 5% to 25% of the functional time.
Is functional utilization the best name to use for this metric?
We considered other names for functional utilization. We thought of:
- Effective utilization. This was rejected because “effective” is similar to and easily confused with “efficiency.”
- Line-limited utilization. This one had some strong internal advocacy but was rejected because we also wanted to have a corresponding time bucket on the E10 Tool State-based chart, and the name “line-limited time” to represent productive time + standby-other didn’t seem accurate.
- Constrained utilization. This one was too easily confused with constraint terminology (the top bottleneck in the fab).
- Buffered utilization. This one just didn’t sound right.
- Net utilization. This was our second choice, but we found “functional” to be more descriptive.
We also considered whether the metric should just be the quantity of standby-other time. That is, what we want to encourage is having a buffer of standby time when no WIP is waiting, so why not just use that as the metric? However, we ultimately decided that having functional utilization as a parallel companion to WIP utilization had value. We also liked the idea that functional utilization drives the function that makes up the operating curve. Finally, one can think of standby-WIP-waiting time as time that is dysfunctional and is excluded from functional time.
We spent quite a bit of time discussing this metric internally. These discussions led to our decision to form a Metrics Team within INFICON to align our definitions of other metrics between the FabTime and FPS software products.
Conclusions
There are various utilization definitions relative to the SEMI E10 tool states that are used for different purposes. The FabTime software historically used manufacturing utilization, which is productive time divided by the time that a tool is available to the manufacturing organization. But what we’ve come to realize is that this definition isn’t sufficiently granular to fully explain cycle time. That’s because not all standby time is created equal.
We normally want some standby time as a buffer against variability, to keep us away from the steep part of the operating curve. Standby time when WIP is waiting for the tool is more a capacity loss than a buffer. Its presence increases cycle time. Not only that, standby-WIP-waiting is a hidden capacity loss, because it’s conflated with standby time when WIP isn’t waiting.
In this article, we have proposed a supplemental definition of utilization that we are calling functional utilization. Functional utilization looks at productive time out of the usable manufacturing time, which is recorded as productive time plus standby time with no WIP waiting. This is the utilization definition that truly drives cycle time. As functional utilization approaches 100%, cycle time will likely be very high. While we don’t, of course, want functional utilization to be zero, we have included suggestions for reducing it to a reasonable target range.
