Subscriber Discussion Forum:
FabTime Newsletter, Volume 26, No 2
We have subscriber discussion about variability for bottleneck and non-bottleneck tools; balancing turns goals; metrics for WIP linearity; hot lots; and operator constraints.

Relative impact of arrival and process time variability for bottlenecks vs. non-bottlenecks
A new subscriber from Taiwan, after studying resources from this newsletter and consulting with a colleague from National Taiwan University, observed that the relative impact of arrival variability vs. process time variability will depend on whether a tool group is a bottleneck. He observed that:
- For bottleneck (high utilization) tools, a high squared coefficient of variation of effective process time will result in a high squared coefficient of variation of the departure process, regardless of whether the coefficient of variation of the time between arrivals to the tool is high or low. This is because the near-constant queue at a bottleneck tool will absorb the arrival variability. When lots arrive at the back of a long queue, the impact of any variation in the arrival pattern of those lots is dampened.
- For non-bottleneck (low utilization) tools that don’t typically have a queue waiting, a high squared coefficient of variation of the arrival process will result in a high squared coefficient of variation of the departure process, whether the coefficient of variation of the effective process time is high or low.
Response from Jennifer: I think these points are intuitively reasonable. I’ve said many times in my cycle time class that when lots are arriving at the back of a long queue, the impact of the arrival variability is lessened. In the low utilization case, without much of a queue to absorb the arrival variability, it makes sense that this arrival variability will be passed downstream, potentially augmented by process time variability.
Consider the simpler versions of the queueing formulas for generating operating curves, when we’re looking at x-factor at the current tool group. See our webinar on the Fundamental Drivers of Wafer Fab Cycle Time (video is at the bottom of the linked web page) for details. Here, it doesn’t matter very much whether variability is from time between arrivals or from process times, because CVa and CVp are weighted equally in the formula (though effective process time variability will also be influenced by downtime distribution when we expand the formula a bit, as discussed in Issue 25.04).
However, a couple of points to keep in mind are:
- The queueing formulas (as reflected in the operating curve spreadsheet) still show arrival variability having a significant impact on cycle time x-factor at extremely high utilizations. However, in a real fab this effect is dampened by the fact that we don’t have infinite WIP. We (hopefully!) never see the highest x-factors that the queueing model predicts from high utilization and variability, because our WIP is capped.
- Even though the average queue time might be low for non-bottleneck tools (because lots usually arrive when the tool is not busy), we should remember that variability doesn’t only impact the current tool. Arrival variability to low utilization tools impacts the variability of the departure process, which becomes the arrival variability for downstream steps.
We appreciate this contribution to the discussion! There’s always more to learn and think about in understanding fab behavior.
How should supervisors allocate operators to balance different turns rate goals?
A long-time subscriber wrote: “How do you deal with shift supervisors who are held to account for turns? They could be responsible for three areas (CMP, Epi, Implant) each having a massively different turns expectation. Because we are a lean operation, associates are trained to work in all three areas.
Human nature has the supervisors sending personnel to the high turns goal area. This can cause problems for the lower turns rate area (Epi), which cannot catch up if it falls behind. Can you use ‘Area Health Charts’ that normalize the turns per hour overlaying each area, showing you where to send personnel?”
Response from Jennifer (after consultation with Paul Campbell, our Smart Manufacturing Specialist):
I think that turns are most useful at the factory level, as an indicator of the pace of the line. For a given route, the turns rate, together with an approximate number of steps per flow, can be a forward indicator of cycle time. If your turns rate drops, this is an early warning that future cycle time will be increasing.
The idea behind using turns for areas is that turns account for shortages and excesses of WIP, so we don’t penalize the person running that area for not meeting a moves goal when there isn’t sufficient WIP. However, turns are not an ideal primary metric for areas because using area-level turns can hurt line balance and increase variability.
A high turns goal in an area means either that we’re expecting to do a high number of moves in that area during the shift or that we expect to have low WIP in the area. In the latter case, this encourages areas with low WIP to make moves that may not be ideal from the fab’s perspective. Conversely, a low turns goal means that we either expect not to do too many moves or we are holding a lot of WIP in the area. In the latter case, use of turns discourages making moves (and assigning associates), even though keeping that WIP moving would be helpful for cycle time improvement. This sounds like exactly what you are describing in the Epi (low turns) area vs. the others.
I think the fact that turns rate depends on both moves and WIP makes it imperfect for deciding where to send personnel. It’s also been my experience that the hourly turns rate in an area can be quite variable. This seems like a question that a scheduler (like INFICON’s Factory Scheduler) should be answering, by setting targets for what specific WIP needs to be moved during the shift. If keeping Epi from falling behind is a priority or constraint, then the scheduler should prioritize having someone do those Epi moves. This avoids the “human nature” part of the decision.
Another way to think about this is to look at which tool groups are the constraint tools for the fab. Those are the tools that we want to ensure don’t sit idle with WIP waiting because there’s no associate to run the tool. Where supervisors see that happening, that’s where they should be sending personnel.
One other idea for improving area performance is to use a metric that we developed with a customer in 2013 called Earned Plan Hours (EPH). EPH is an alternative to moves for tracking production activity. EPH gives credit both when lots are tracked into tools, and as processing occurs on tools. Thus, EPH provides an incentive to keep tools running, even near shift change. (See Issue 14.01, available to subscribers from the FabTime Newsletter Archive, for details.)
My response here is not to share a better way of using turns to avoid this problem, but to propose that other metrics may be better used for tracking area performance. Sorry if that’s not helpful.
I would love to have input from other subscribers on whether they use turns in this way or have any suggestions. Does anyone have anything to add here?
Metrics for WIP linearity
A new subscriber asked: “Is there an established metric to quantify and visualize WIP balance in a manufacturing line that can be used to show a trend? We are looking for something that highlights missing moves in parts of the flow as well as ‘too many’ moves in other parts of the flow. Maybe you can point me to corresponding papers.”
Response from Jennifer: One metric that we have in the FabTime reporting software that could capture this is WIP Goal Delta. Data for this chart is initially calculated at the object level for whatever the customer chooses to slice by and then can be aggregated over time to look at trends. To look at line linearity, what you could do if your fab is in a relatively steady state in terms of starts is look by segment or sub-segment of the line (usually a segment is about a week of process flow, while sub-segments are smaller) and set a WIP goal that is the same for each segment. Then you can look at the absolute delta between that goal and the actual WIP by segment, summed across the segments, and reported over time. You’d be looking for an absolute delta as close to zero as possible. Note that if the WIP levels in the fab change, and/or the start rate changes significantly, it might be necessary to adjust the targets.
Here’s an example of a snapshot of this WIP Goal Delta by Segment:

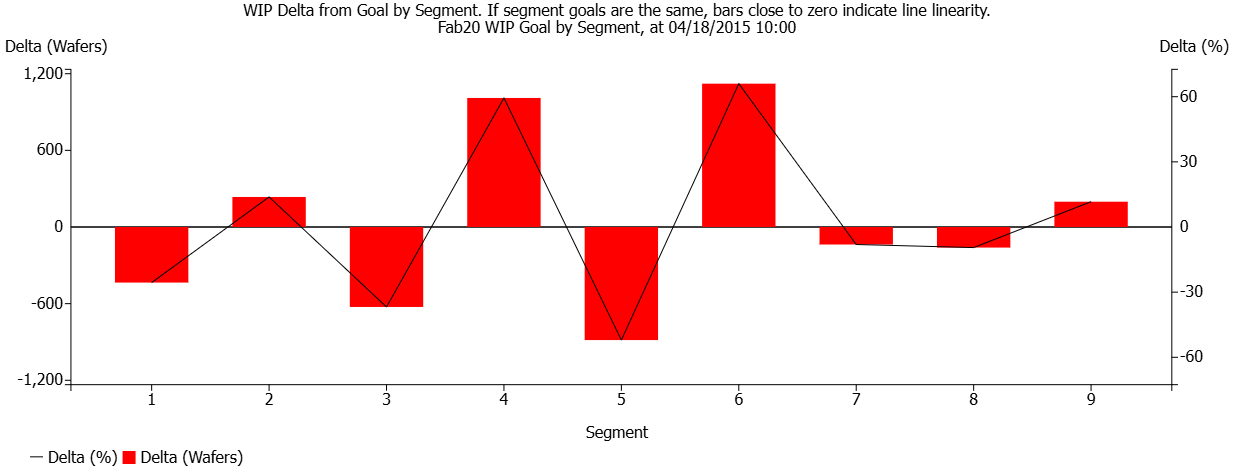
We can see that the early and late segments do well meeting the WIP target, but the segments in the middle are more variable. And here is a rolled-up trend version:
. Where segment goals are the same, lower values indicate better line linearity.")
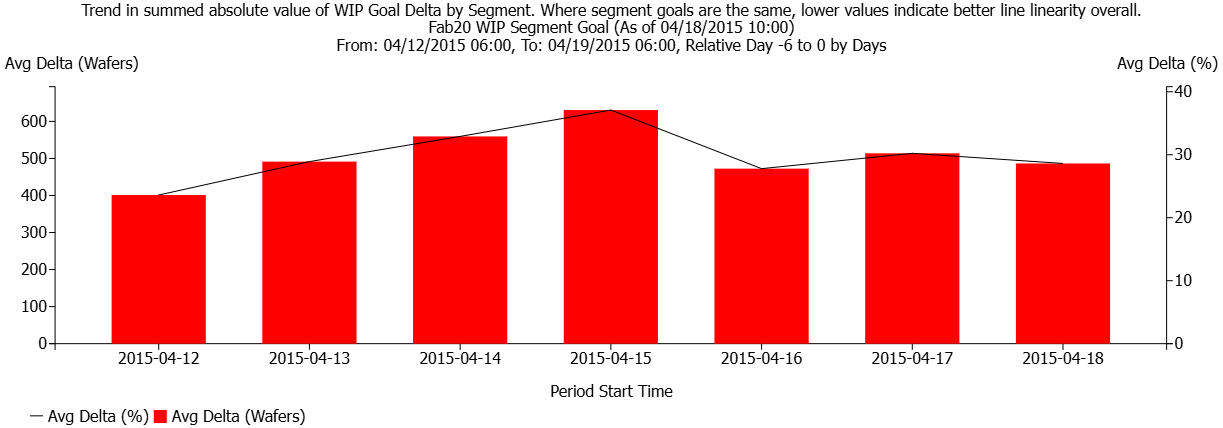
The height of the right-most bar on the bottom chart is the sum of the absolute values displayed on the top chart. Where segment goals are the same, lower values on this chart indicate better linearity. I like this metric because it’s flexible (you can define the segments or sub-segments as you like).
The INFICON Scheduler and Factory Dashboard also use a line balance metric for ensuring WIP Linearity. The calculations are similarly based on the absolute value of the largest effective delta to target WIP or the largest WIP target in the facility, whichever is greater.
Do any other subscribers have other metrics to suggest here for maintaining WIP linearity?
Why weren’t hot lots on the list of factors influencing cycle time in the previous issue?
A longtime subscriber wrote in response to the February issue: “I am wondering that priority corridors (e.g. hot lots) did not at all appear in the list of detrimental factors to wafer fab cycle time, since it complicates on-time-delivery and increases variance of fab cycle time for the regular lots, I would think.”
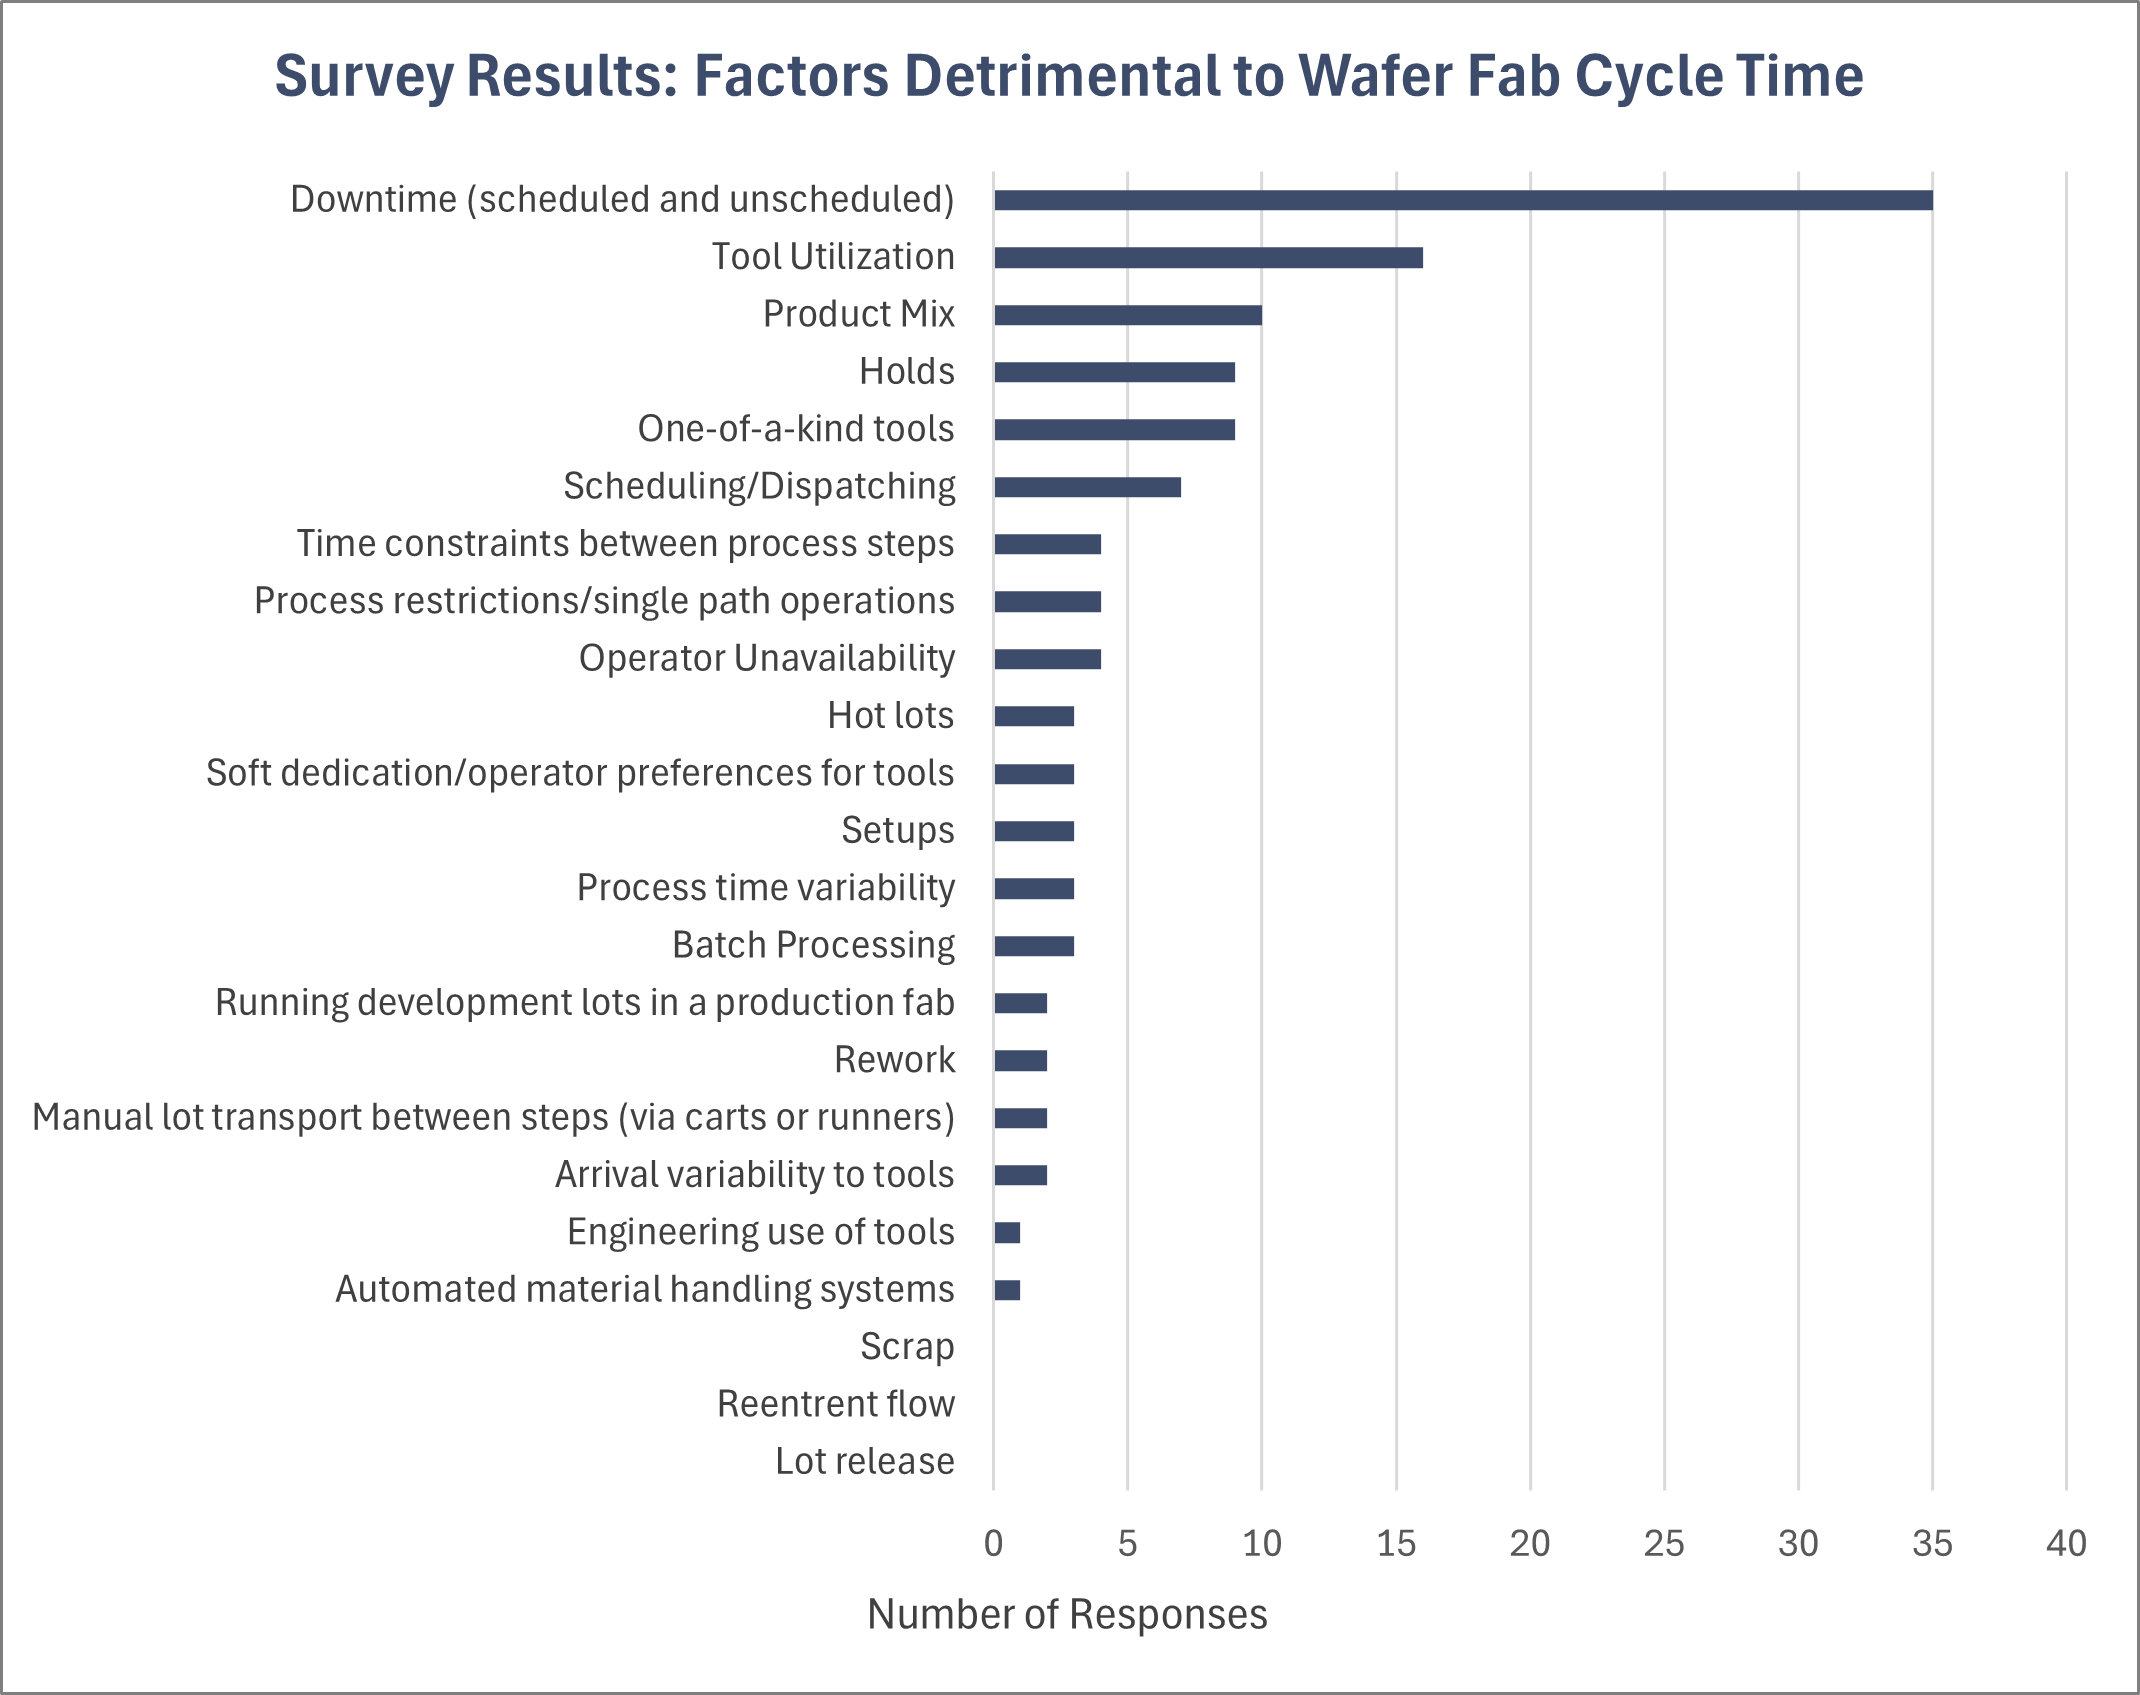
Response from Jennifer: Thank you for noticing that hot lots weren’t on the list in the graphic. That was due to an editing error on my part. I checked the spreadsheet I used to compile the results, which I had reformatted since publishing the earlier issue on this topic and discovered that I had combined hot lots with holds. They are separated properly in the figure below (nine responses for holds and three for hot lots).
This survey question, which was on the FabTime website for a time, received 123 total responses. As people could only select one factor, I’m not surprised that hot lots weren’t selected frequently. I do think that downtime, tool utilization, and product mix have a greater impact for most fabs, though I agree that hot lots increase variability (and sometimes cause capacity losses), and thus do impact fab cycle time.
For more about the impact of hot lots on cycle time, see Issues 19.03 and 25.01.
, updated to fix a previous error.")
How can I model operator constraints?
A new subscriber wrote: “One of the areas that I am interested in is not just equipment utilization, but people utilization. In most areas I am more people constrained than equipment constrained. I did find your newsletter on that subject but also would be interested in how to effectively model that constraint with the other three cycle time drivers.”
Response from Jennifer: We don’t have a lot of content on the impact of operators beyond what’s included in our past newsletters on that topic, though we do also discuss this in our cycle time class.
In general, you can think about how operators affect the three fundamental drivers of cycle time.
- Operators effectively increase utilization because you end up having either:
a. Inflated process time because no operator is available to unload the tool (which you can sometimes measure as post-process time); or
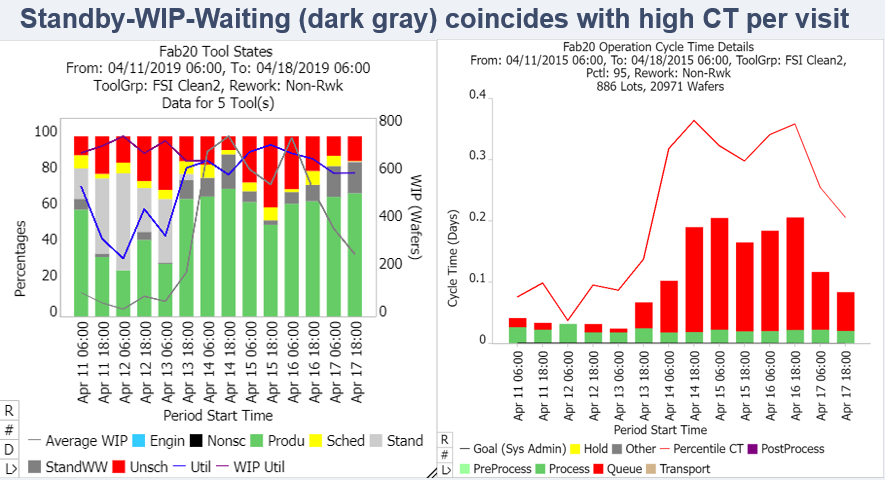
b. Wasted capacity due to tools sitting idle with WIP in front of them because there’s no operator to load the tool (which you can measure as standby-WIP-waiting time, as shown below).
- Operators increase variability. This can be hard to quantify, however.
- Operators can reduce the number of available qualified tools. This happens when you can’t run tools because you don’t have enough operators, or when operators just don’t run as many tools as you expect, resulting in soft dedication.

What I would focus on most would be #1. Try to measure where operators are driving up utilization on tools, particularly where this is happening on your bottleneck tools. And then try to reallocate operators where your cycle time is the highest. These are things that INFICON can help you pull out of the data with FabTime and Factory Dashboard, but you might also find that your supervisors know where this is happening already. Do other subscribers have anything else to suggest here?
We welcome the opportunity to publish subscriber discussion questions and responses. Submit your responses here.
Past issues of the newsletter are available for subscribers to download in PDF format. Existing subscribers can find the archive link in your most recent email newsletter. New subscribers will see the link upon registering.
- Main article for Volume 26, No. 2: Is a standard definition for moves possible?
- Community Announcements page for Volume 26, No. 2


Want to learn more about cycle time drivers in your fab?
