The Waddington Effect on Wafer Fabs
Exploring a condition in which doing scheduled maintenance can sometimes cause a short-term increase in unscheduled downtime.

By Jennifer Robinson
As we’ve been recommending metrics for mitigating the impact of downtime on fab cycle time, something we’ve wondered about is the impact of The Waddington Effect. The Waddington Effect, named and promoted by author James P. Ignizio, is based on World War II era research into maintenance of the British RAF’s B-24 Liberator Bombers. Researcher C. H. Waddington and his team found that scheduled maintenance of these aircraft, if too frequent, could do “positive harm by disturbing a relatively satisfactory state of affairs.” Specifically, Waddington found that unscheduled downtime events increased after scheduled maintenance, rather than decreasing. (See this Sport Aviation Magazine article by Mike Busch for an overview.)
This result seems potentially in conflict with recommendations in this newsletter (see Issue 22.01, e.g.) and our cycle time course to refrain from grouping maintenance events. We’ve made that argument based on the observation that longer periods of unavailable time are much worse for cycle time than shorter periods. All else being equal, this is certainly true. However, if more frequent scheduled maintenance events lead to subsequent longer unscheduled downtime events, overall cycle time could end up worse.
In this article, we introduce the Waddington Effect, as well as Waddington Effect Plots. We then propose a resolution to the apparent conflict between our recommendation for more frequent maintenance events and Waddington’s implicit recommendation for doing less frequent maintenance. As always, we welcome your feedback.
What is the Waddington Effect?
According to an article by James Ignizio in the September 2010 issues of PHALANX Magazine (the quarterly journal of the Military Operations Research Society), C. H. Waddington was a geneticist who was assigned during World War II to a British military operations research group. The Operational Research Group was asked to increase the effectiveness of the British bomber command by reducing the time aircraft spent on the ground between flights.
Ignizio reports that:
“[B]efore scurrying about to provide a slick briefing on a scheme that might or might not work, Waddington and his team had the audacity to stop and think. They requested and analyzed the supporting data, talked with maintenance crews, and took time to carefully and personally observe actual maintenance events.”
Ignizio termed what they discovered the Waddington Effect. They plotted the number of unscheduled downtime events, along with the time since the most recently scheduled maintenance event. Their graph showed that soon after scheduled maintenance events, the number of repairs needed increased, declining over time until approximately the time that the next maintenance event was scheduled.
Waddington concluded (as quoted by Ignizio) that:
“[I]nspection tends to increase breakdowns, and this can only be because it is doing positive harm by disturbing a relatively satisfactory state of affairs. Secondly, there is no sign that the rate of breakdown is beginning to increase again after the 40-50 flying hours, when the aircraft is coming due for its next [preventive maintenance event].”
In other words, says Ignizio:
“[T]he Waddington Effect is defined as a ‘spike’ in the number and frequency of unscheduled events ‘closely’ following a scheduled event – followed in turn by a gradual decline in the rate of occurrence of unscheduled events to a ‘more normal level,’ until a repeat of this same, troublesome effect following the next scheduled maintenance event.”
The solution that Waddington’s team proposed to this effect was to improve the execution of the maintenance events and their scheduling, including adding much better documentation. The outcome of these improvements was a 60% increase in the effective size of the British Coastal Command air fleet, without adding equipment or personnel. Isn’t it amazing what industrial engineering can accomplish?
One other note here is that the Waddington Effect may be considered part of the declining failure rate (DFR) portion of a bathtub-shaped failure rate curve that is observed in many mechanical devices. An initial period of declining failure rate due to initial defects is followed by a period with a relatively constant failure rate (CFR). A later period of increasing failure rate (IFR) is then observed as the system ages and starts to wear out. (See Hopp and Spearman’s Factory Physics text (Irwin, 1996) for details). In wafer fabs, the consequences of the IFR are high, so PMs ideally take place prior to that later period of increasing failure rate.


Want to learn more about cycle time drivers in your fab?
What are Waddington Effect Plots?
In Ignizio’s book, Optimizing Factory Performance (McGraw Hill, 2009), he proposes the use of Waddington Effect Plots for analyzing and reducing equipment downtime in factories. Waddington Effect Plots are graphs like the ones that Waddington and his team used, meant to identify situations where an increase in unscheduled downtime closely follows a preventive maintenance event (PM).
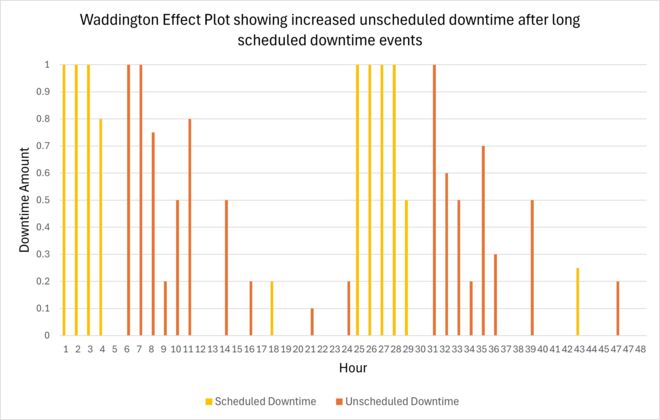
To create a Waddington Effect Plot for a tool, Ignizio says to create a bar graph with each hour along the x-axis, and the height of the bar indicating the downtime amount during that hour, colored for scheduled or unscheduled. Ignizio shows an example in his book based on actual factory data for a tool that required a five-hour (average) PM every 40 hours. The example shows considerable unscheduled downtime occurring shortly after the PM then tapering off over the next 12 hours.
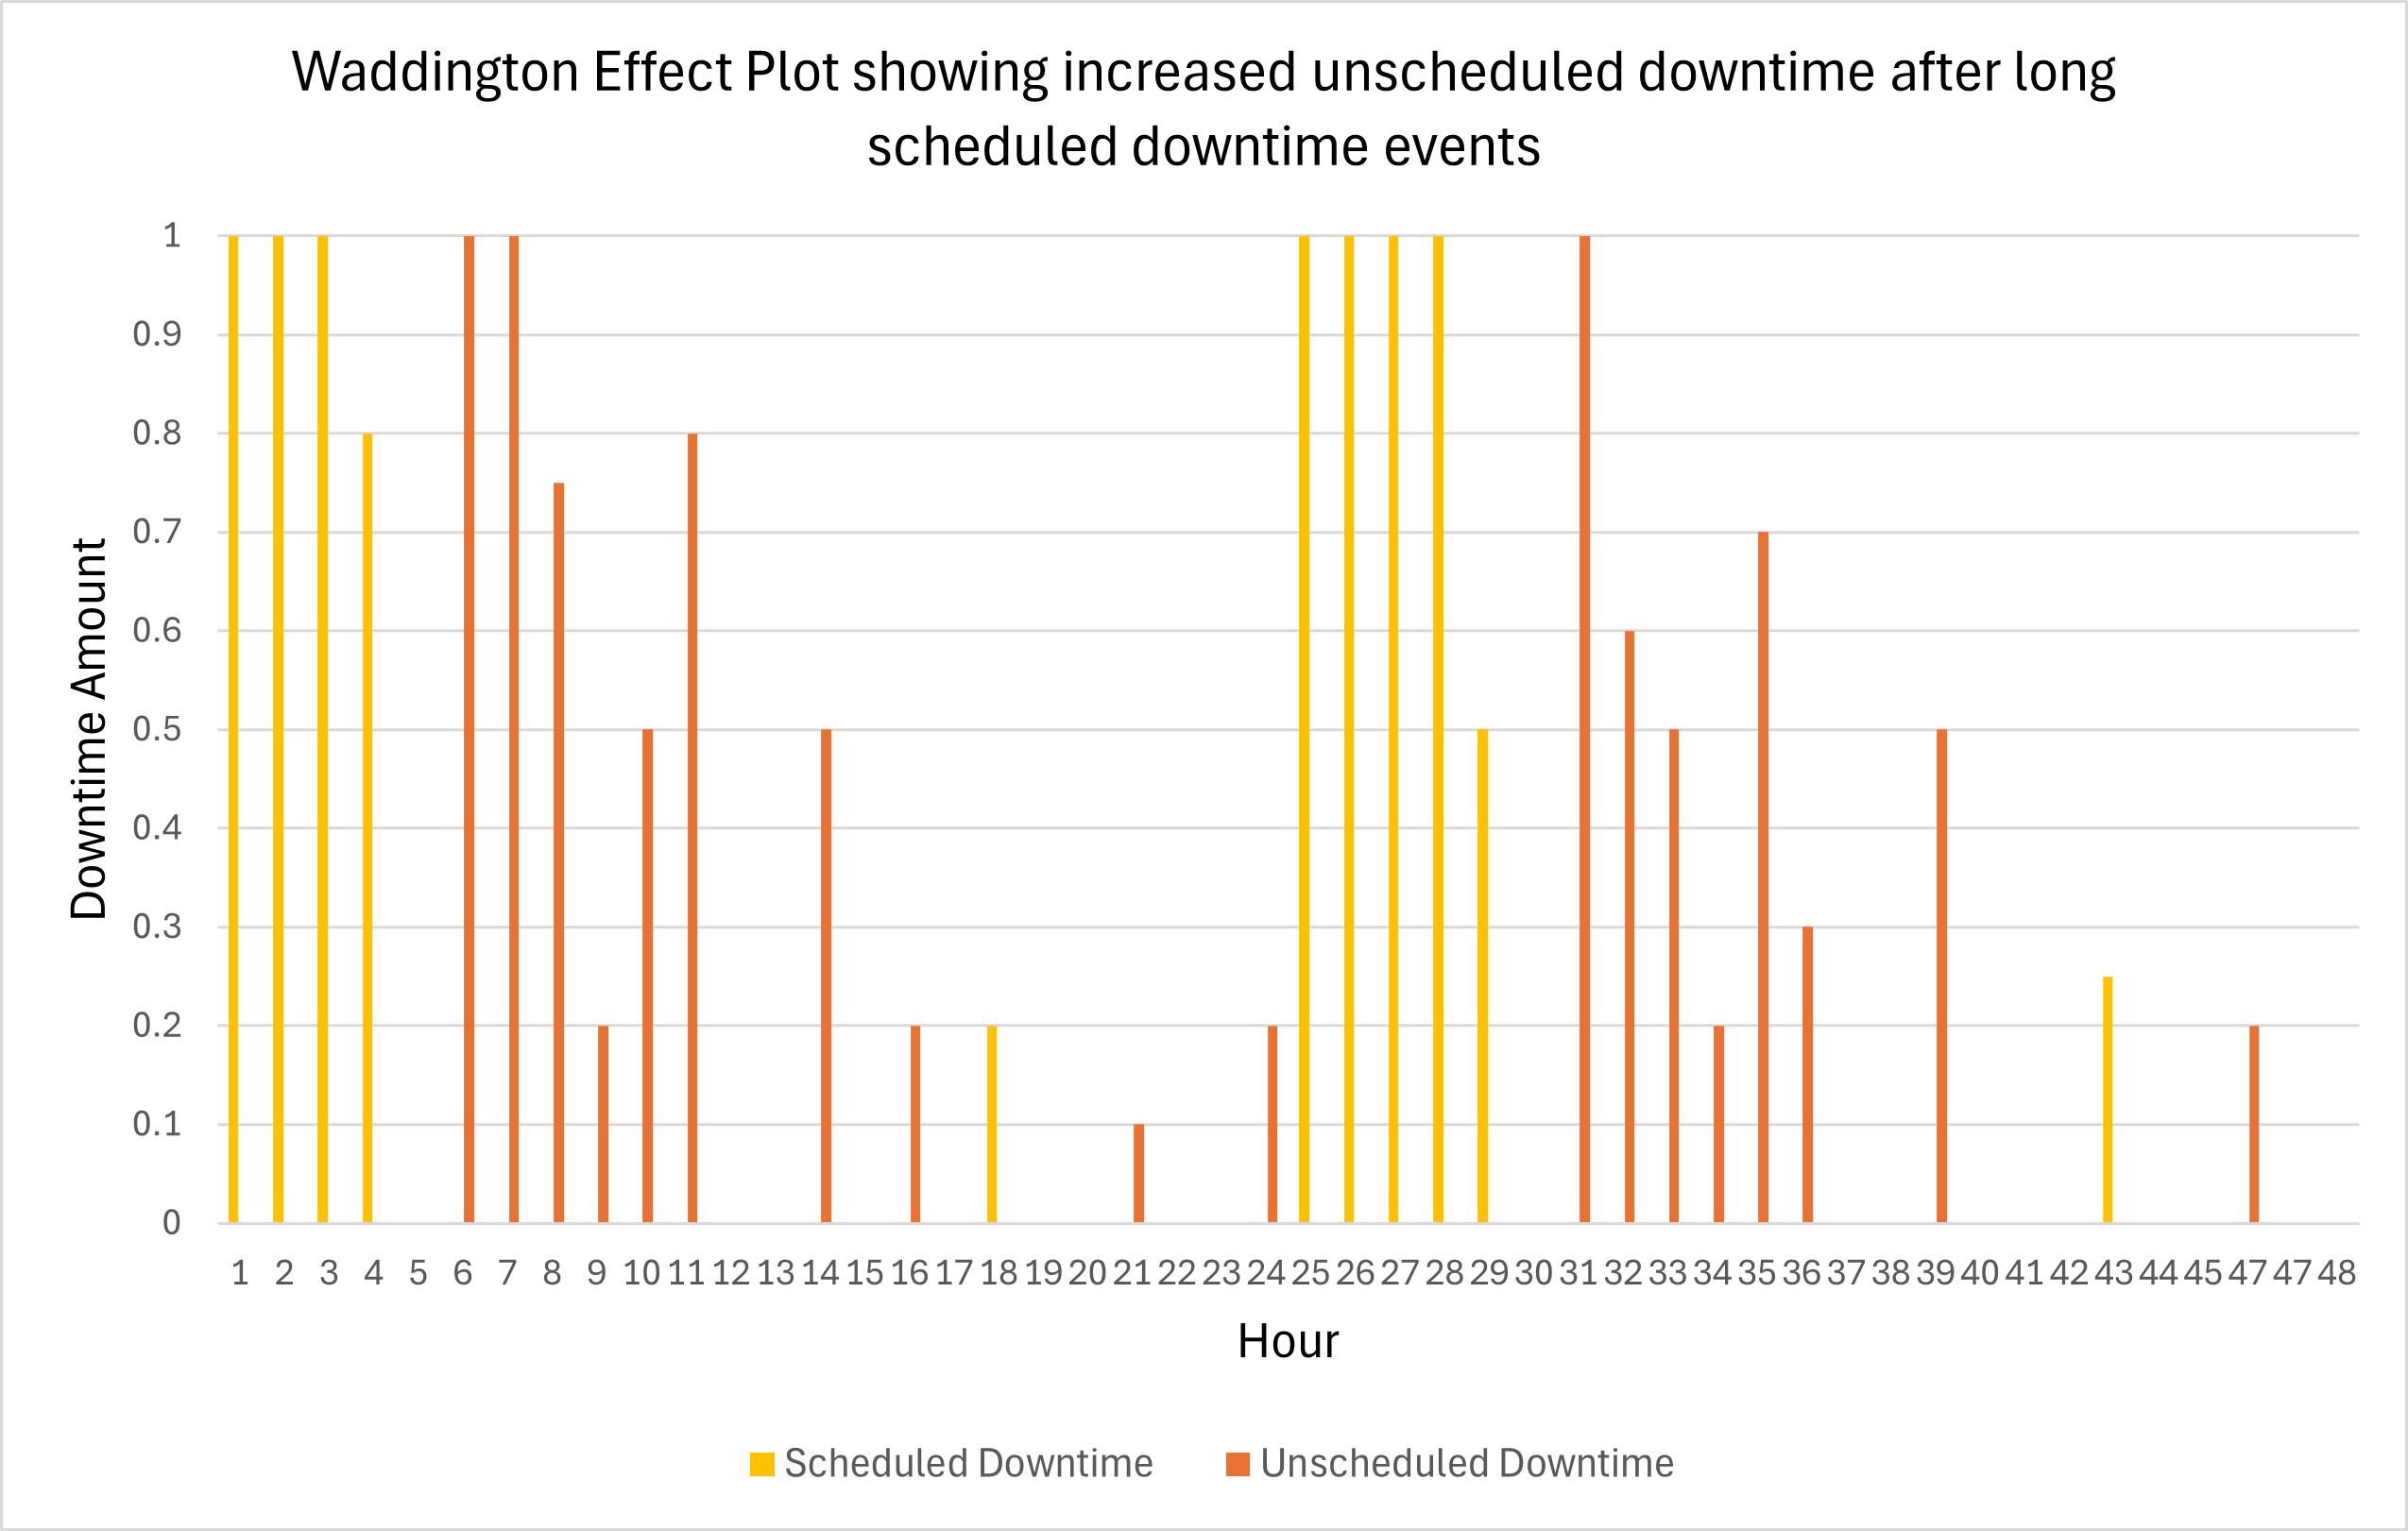
A similar example created in Excel is shown below. The first long PM (shown in yellow) lasts 3.8 hours and is followed shortly thereafter by a 2.7-hour unscheduled downtime. More downtime follows, then tapers off. The second long PM lasts 4.5 hours and is similarly followed by a period of increased unscheduled downtime that tapers off.
In this contrived example, it is straightforward to infer just from looking at the chart that a Waddington Effect may be occurring. But, of course, if we are to use these plots in practice, we want a) a way to easily generate them on an ongoing basis, b) a way to automatically detect the Waddington Effect from the data, and c) advice on what to do next if we do detect it. Let’s look at each of these in turn.
How can we create Waddington Effect Plots Using FabTime
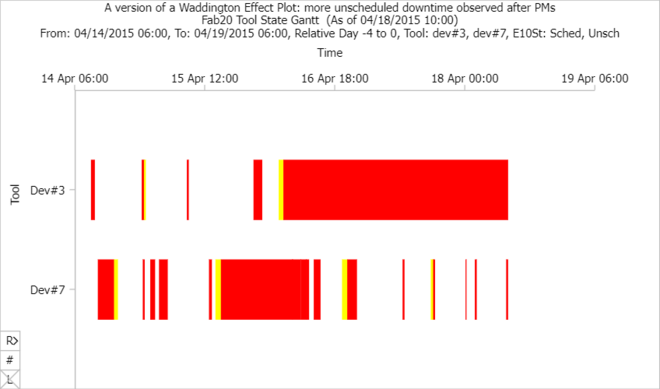
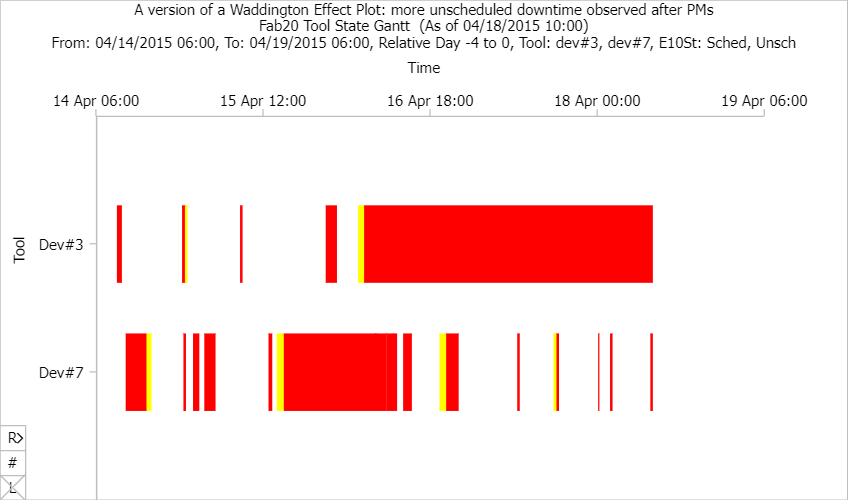
While we don’t directly have Waddington Effect Plots in the FabTime reporting module, we do have Tool State Gantt charts that, if filtered to only include scheduled and unscheduled downtime, convey similar information. The chart below shows the pattern of scheduled and unscheduled downtime for two tools over a five-day period. This example is from our demo server and does show a large block of unscheduled downtime occurring immediately after scheduled downtime for each tool. We might look at this chart and conclude that the scheduled downtime had influenced the unscheduled downtime (although in practice we would want to see more data, over a longer period).
FabTime software users can easily create a similar view by filtering the Tool State Gantt chart to include the tools of interest (using the “Tool”, “ToolGrp”, or “Area” filters), selecting the time window of interest, and entering “Sched, Unsch” in the “E10St” filter. They can then save the chart by adding it to a home page tab.
How can we detect the Waddington Effect on an ongoing basis?
Ignizio recommends either using visual inspection or “automated pattern recognition analysis” to identify the existence of the Waddington Effect. A next step in using the Tool State Gantt chart in FabTime to create Waddington Effect Plots would be to in some way automatically detect the Waddington Effect, rather than relying on someone to visually notice it for a given tool.
One idea for doing this would be to record the percentage of unscheduled downtime occurring within a defined time window after a scheduled downtime event and compare that to the overall percentage of unscheduled downtime on the tool. But what time window should we use? Should we do this for every PM, or only for those longer than some amount of time?
Fortunately, INFICON has a brand-new Data Science team with members who can think carefully about these questions and recommend solutions to implement. If any subscribers have considered and/or implemented Waddington Effect detection and would like to share your thoughts, please send them to Jennifer Robinson. We will follow up on this topic in a future issue.
So, is the Waddington Effect in conflict with this newsletter’s previous cycle time improvement recommendations?
Before we move on to what to do if we detect the Waddington Effect, let’s return to the question of whether Waddington’s results conflict with this newsletter’s recommendation to separate maintenance events.
The Waddington Effect shows that in some cases, if things are running smoothly, doing a PM can disturb the system and cause problems. This effect, where it occurs, could lend support for the idea of grouping PMs. If each PM increases the chance of significant amounts of unscheduled downtime occurring, we might be better off performing fewer PMs.
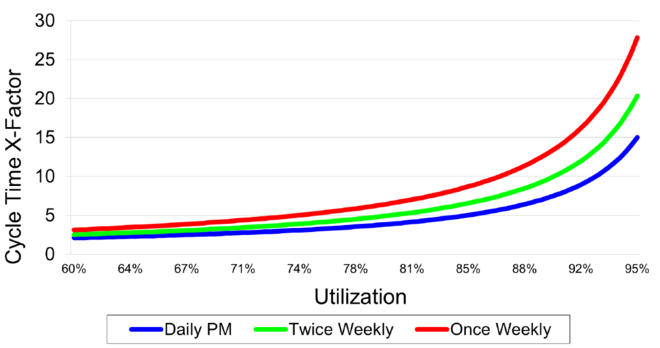
However, we also know from our work with cycle time operating curves that longer periods of unavailable time are generally much worse for cycle time than shorter ones. For example, the chart below depicts the impact of shorter, more frequent PMs (the blue graph) vs. longer, less frequent PMs (the green and red graphs) for the same total amount of unavailable time. The longer PMs have a much worse impact on cycle time, with the cycle time per visit for the weekly PM being nearly twice as high as the cycle time per visit for the daily (one seventh as long) PM.
So, we repeat a question that we ask during our cycle time course. For the same amount of scheduled maintenance, should you group your PMs?
We think that the answer to this question is still generally no. However, we suggest adding a regular check to see whether the Waddington Effect is occurring in your fab. For tool groups where there is no observed Waddington Effect, we can stick with the prior recommendation not to group PMs. (There may be exceptions in special circumstances, as when there’s no WIP waiting for the tool, the fab is tightly constrained on engineers, or additional quals are very expensive).
Where you do observe a potential Waddington Effect, the answer shouldn’t be to do as few PMs as possible. This is like hearing a clunking noise in your car engine and deciding to turn up the radio so that you don’t listen to it. The Waddington Effect means that something is wrong in your maintenance approach. Therefore, the answer should be to figure out what’s causing the Waddington Effect for this tool group and eliminate that.
What should we do if we detect the Waddington Effect?
Going back to the PHALANX Magazine article, Ignizio focuses on identifying the causes behind the Waddington Effect and then eliminating or reducing the effect by targeting unnecessary complexity and excess variability. He states that having clear documentation of maintenance specifications is especially important.
Informed by this advice, here are our recommendations for fabs. Where the Waddington Effect is detected, we should:
- Analyze whatever data is available to identify the underlying causes behind the effect.
- Eliminate those underlying causes, with particular focus on reducing variability.
- Learn from this experience and communicate with the team ways to avoid the problem in the future.
As an anecdotal example, we spoke with an engineer who worked at a fab that observed the Waddington Effect after major PMs (40 hours long) for a particular cluster tool. Despite extensive efforts to weed out the root causes of this effect, this fab struggled to eliminate the problem. They eventually dropped that tool from later process flows. In other cases, however, they were able to reduce the chances of the Waddington Effect by focusing on quality and reproducibility.
This fab generally found that shorter PMs had less risk of “going sideways” and that shorter, more frequent PMs were thus less subject to the Waddington Effect than longer ones. This, of course, is consistent with our overall recommendation of seeking shorter periods of unavailable time overall.
It’s perhaps worth noting here that Ignizio, who has long promoted the Waddington Effect, also advocates for “declustering” PMs in the factory, to reduce their impact on cycle time.
Conclusions
During World War II, C. H. Waddington and his Operational Research Group worked to improve equipment reliability for British aircraft. The team found that in some cases, when a piece of equipment was performing well, intervening to perform preventive maintenance could increase the possibility of unscheduled downtime occurring soon thereafter. Professor James Ignizio later deemed this behavior the Waddington Effect and proposed the use of Waddington Effect Plots to detect it in modern factories. Ignizio advocated for eliminating the Waddington Effect, where found, through identifying root causes, reducing complexity and variability, and improving documentation.
After reading about the Waddington Effect, we were initially concerned that it might conflict with our repeated recommendation in this newsletter to perform shorter, more frequent maintenance events, rather than grouping them. On further reflection, however, we have concluded that what makes sense is for fabs to guard against the Waddington Effect and eliminate it where it is observed, while continuing to strive for shorter periods of unavailable time.
In this article we have shown how a version of a Waddington Effect Plot can be generated using the FabTime reporting module. We also began discussing ways to automatically identify the Waddington Effect. We also briefly discussed recommendations for mitigating the effect where found. We look forward to sharing further results in the future and welcome your feedback in the meantime.
