Why and How Fabs Should Focus on CT Improvement
Why good cycle time matters for fabs, why it’s difficult to achieve, and what we should do at a high level to improve it.

By Jennifer Robinson
As we start a new year, I thought it would be a good time to take a step back from the details and talk about why good cycle time matters for fabs, why it’s difficult to achieve, and what we should do at a high level to improve it. If your management team doesn’t believe that it’s worth investing in cycle time improvement, or doesn’t know how to get started, please consider passing along this issue.
Why is cycle time improvement worthwhile financially?
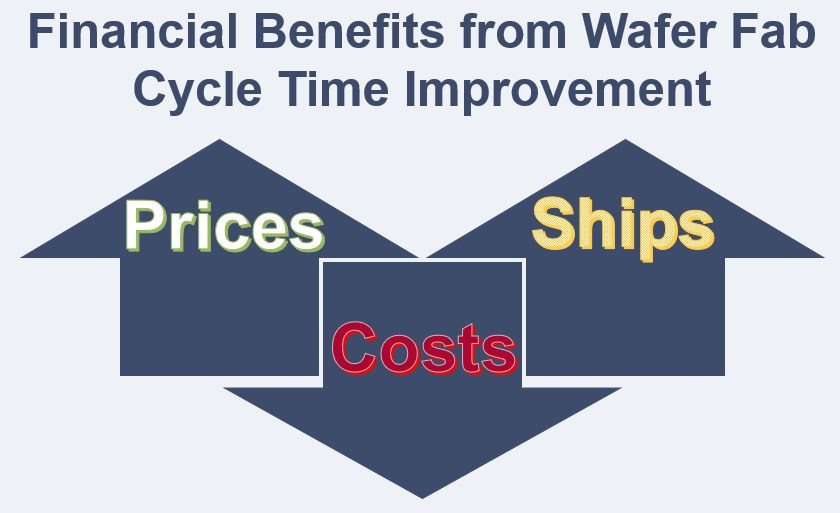
There are three broad financial justifications for improving wafer fab cycle time:
- Lower costs.
- Higher prices.
- Increased throughput.

1. Lower Costs
There are two primary ways that cycle time improvement helps to reduce costs: 1) by lowering the amount of WIP in the fab; and 2) by reducing scrap and rework.
Lower WIP: We know from Little’s Law that if a fab retains the same throughput rate and reduces cycle time, WIP will also be reduced. (See Issue 21.06: Little's Law and Metrics Selection, available for download by subscribers from the FabTime Newsletter Archive. See details below.) WIP reduction offers three opportunities for reducing costs:
- ECN savings. When there is less WIP in the fab, and an Engineering Change Notice is issued, fewer wafers will be affected. The cost savings can be estimated as Change in WIP * ECN % * Cost per wafer to address an ECN.
- Lower cost of carrying WIP. Decreasing the WIP level in a fab results in a one-time reduction in the cost of carrying that WIP.
- Less risk of writing off obsolete inventory (less safety stock required). Whenever a fab holds inventory in post-fab, there’s a possibility that some portion of that inventory will become obsolete before it can be sold. Having a shorter cycle time reduces the amount of inventory that must be held as safety stock and thus reduces the probability of that inventory being written off.
Less Scrap and Rework: Most people I talk with believe that shorter cycle times lead to fewer wafers scrapped. There’s an intuitive argument that the less time a wafer spends in the fab, the less chance there is for something to go wrong. There’s also the idea that if there’s less WIP in the fab (as there will be if cycle times are reduced), then the fab team will learn about equipment problems sooner, such that fewer wafers will be impacted.
Better yields lead to reduced costs of:
- Raw wafers (we don’t have to start as many wafers to achieve the same throughput).
- Consumables (we don’t waste consumables on wafers that are eventually scrapped).
Similarly, having shorter cycle times probably correlates with doing less rework. As one example, the higher the WIP, the greater the chance of a time constraint between process steps being violated and triggering rework. (See Issue 24.02: Managing Time Constraints between Process Steps in Wafer Fabs.) Doing less rework will also reduce consumables costs. See Issue 22.03 in our newsletter archive for more on the impact of rework on fab cycle time.
Having less scrap and rework frees up some wasted capacity on tools (capacity spent processing wafers that were later scrapped or re-processing rework). This helps to reduce cycle time further, leading to a positive feedback cycle.
2. High Prices from Reduced Time to Market
Increased sales revenue may be the most promising path in terms of justifying the cost of cycle time improvement efforts. It is also the path that is hardest to quantify, because it requires assumptions about what customers will pay in the future. However, as a very simple example, suppose that by reducing cycle time by 20%, your company can get a key new product to market more quickly, and can charge a 30% price premium (for some limited time). You can easily do the math to estimate what that might be worth for your company.
Here are three potential paths to increased sales revenue from shorter cycle time:
R1) Design Wins - Increased Cycles of Learning:
Shorter R&D cycle times -> More cycles of learning during product development -> More time for experimentation and product refinement -> More competitive products -> Increased design wins -> Increased revenue.
R2) Design Wins - First to Market:
Shorter R&D cycle times -> Faster product development -> First to market -> Increased design wins -> Increased revenue.
R3) Pricing Premium - First to Market:
Shorter R&D cycle times -> More cycles of learning during product development -> Faster product development -> First to market -> New product pricing premium -> Increased revenue.
Of course, this matters more during certain parts of the market cycle and in certain market niches. But it is certainly true that shorter cycle time can correspond to higher revenue in many cases. If you work in a foundry, you may know exactly what the value of shorter cycle time is to your customers. See Volume 7, No. 7: Financial Justification for Cycle Time Improvement Efforts and Volume 3, No. 5: The Bottom-Line Benefits of Cycle Time Management, both available for download by subscribers from the FabTime Newsletter Archive, for more details.
3. Increased Throughput
When industrial engineers plan capacity for a wafer fab, they plan to run each tool at some percentage of the time that the tool is available to manufacturing. As has been extensively discussed in this newsletter, it is typical to include a certain amount of buffer capacity for each tool, rather than planning to run the tools at 100% utilization. This buffer capacity helps the fab to recover from variability and avoids unacceptably high cycle times. The size of the buffer can vary depending on the number of like tools in a tool group, the cost of the tool, and other considerations. A typical buffer for tools with some redundancy is 15% of available time.
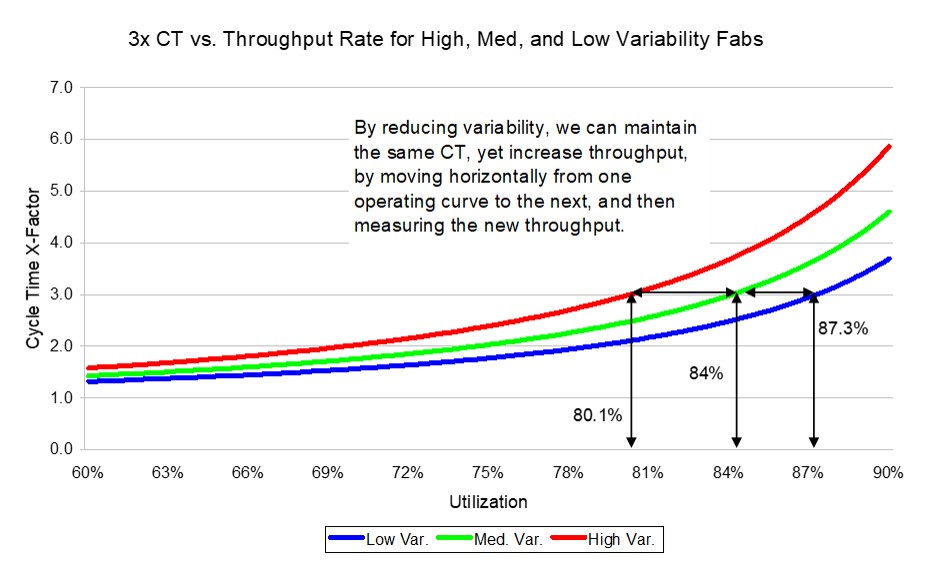
If a fab does a great job of reducing cycle time by reducing variability, it may be possible for that fab to reduce the buffer capacity on key tool groups. This allows the fab to flatten out the operating curve and achieve the target cycle time at a slightly higher loading of the tools. This means that for the same toolset and cycle time target, the fab can start additional wafers. If market conditions are such that the fab can sell the additional wafers, the financial benefit is easy to quantify (net profit per wafer times additional wafers produced over some time period).
An example is shown below. If this fab has a target average cycle time of 3X, and they are in the highest variability condition (the red curve), they’ll have to limit the utilization of the bottleneck to 80.1%. Moving to a lower variability condition (the green curve) would allow them to increase bottleneck loading to 84%. Moving to the blue curve would allow that loading to increase to 87%. While the magnitude of this bottleneck utilization increase might be exaggerated, even a 1% or 2% increase in bottleneck loading (and hence in fab throughput) could be significant financially.

What other reasons are there to strive for good cycle times in the fab?
In the above section, we’ve explored several paths to reduced cost and/or increased revenue for a fab due to improved cycle time. Other benefits may be harder to quantify, but also add value. For example:
- Shorter cycle times result in happier customers. Shorter cycle times are usually also more predictable cycle times, resulting in better on-time delivery (OTD) performance. Better OTD performance makes customers happy.
- Shorter cycle times result in happier managers. A leaner fab with less WIP is more flexible and ready for market changes. A fab carrying less WIP is easier to manage in general.
Happier customers and happier employees. What’s not to like about that?
Given these many incentives, why don’t fabs have better cycle time?
The short answer regarding why fabs don’t have better cycle time is: cost, complexity and change.
- Wafer fab equipment is expensive.
- A new cutting edge fab can cost up to $20B.
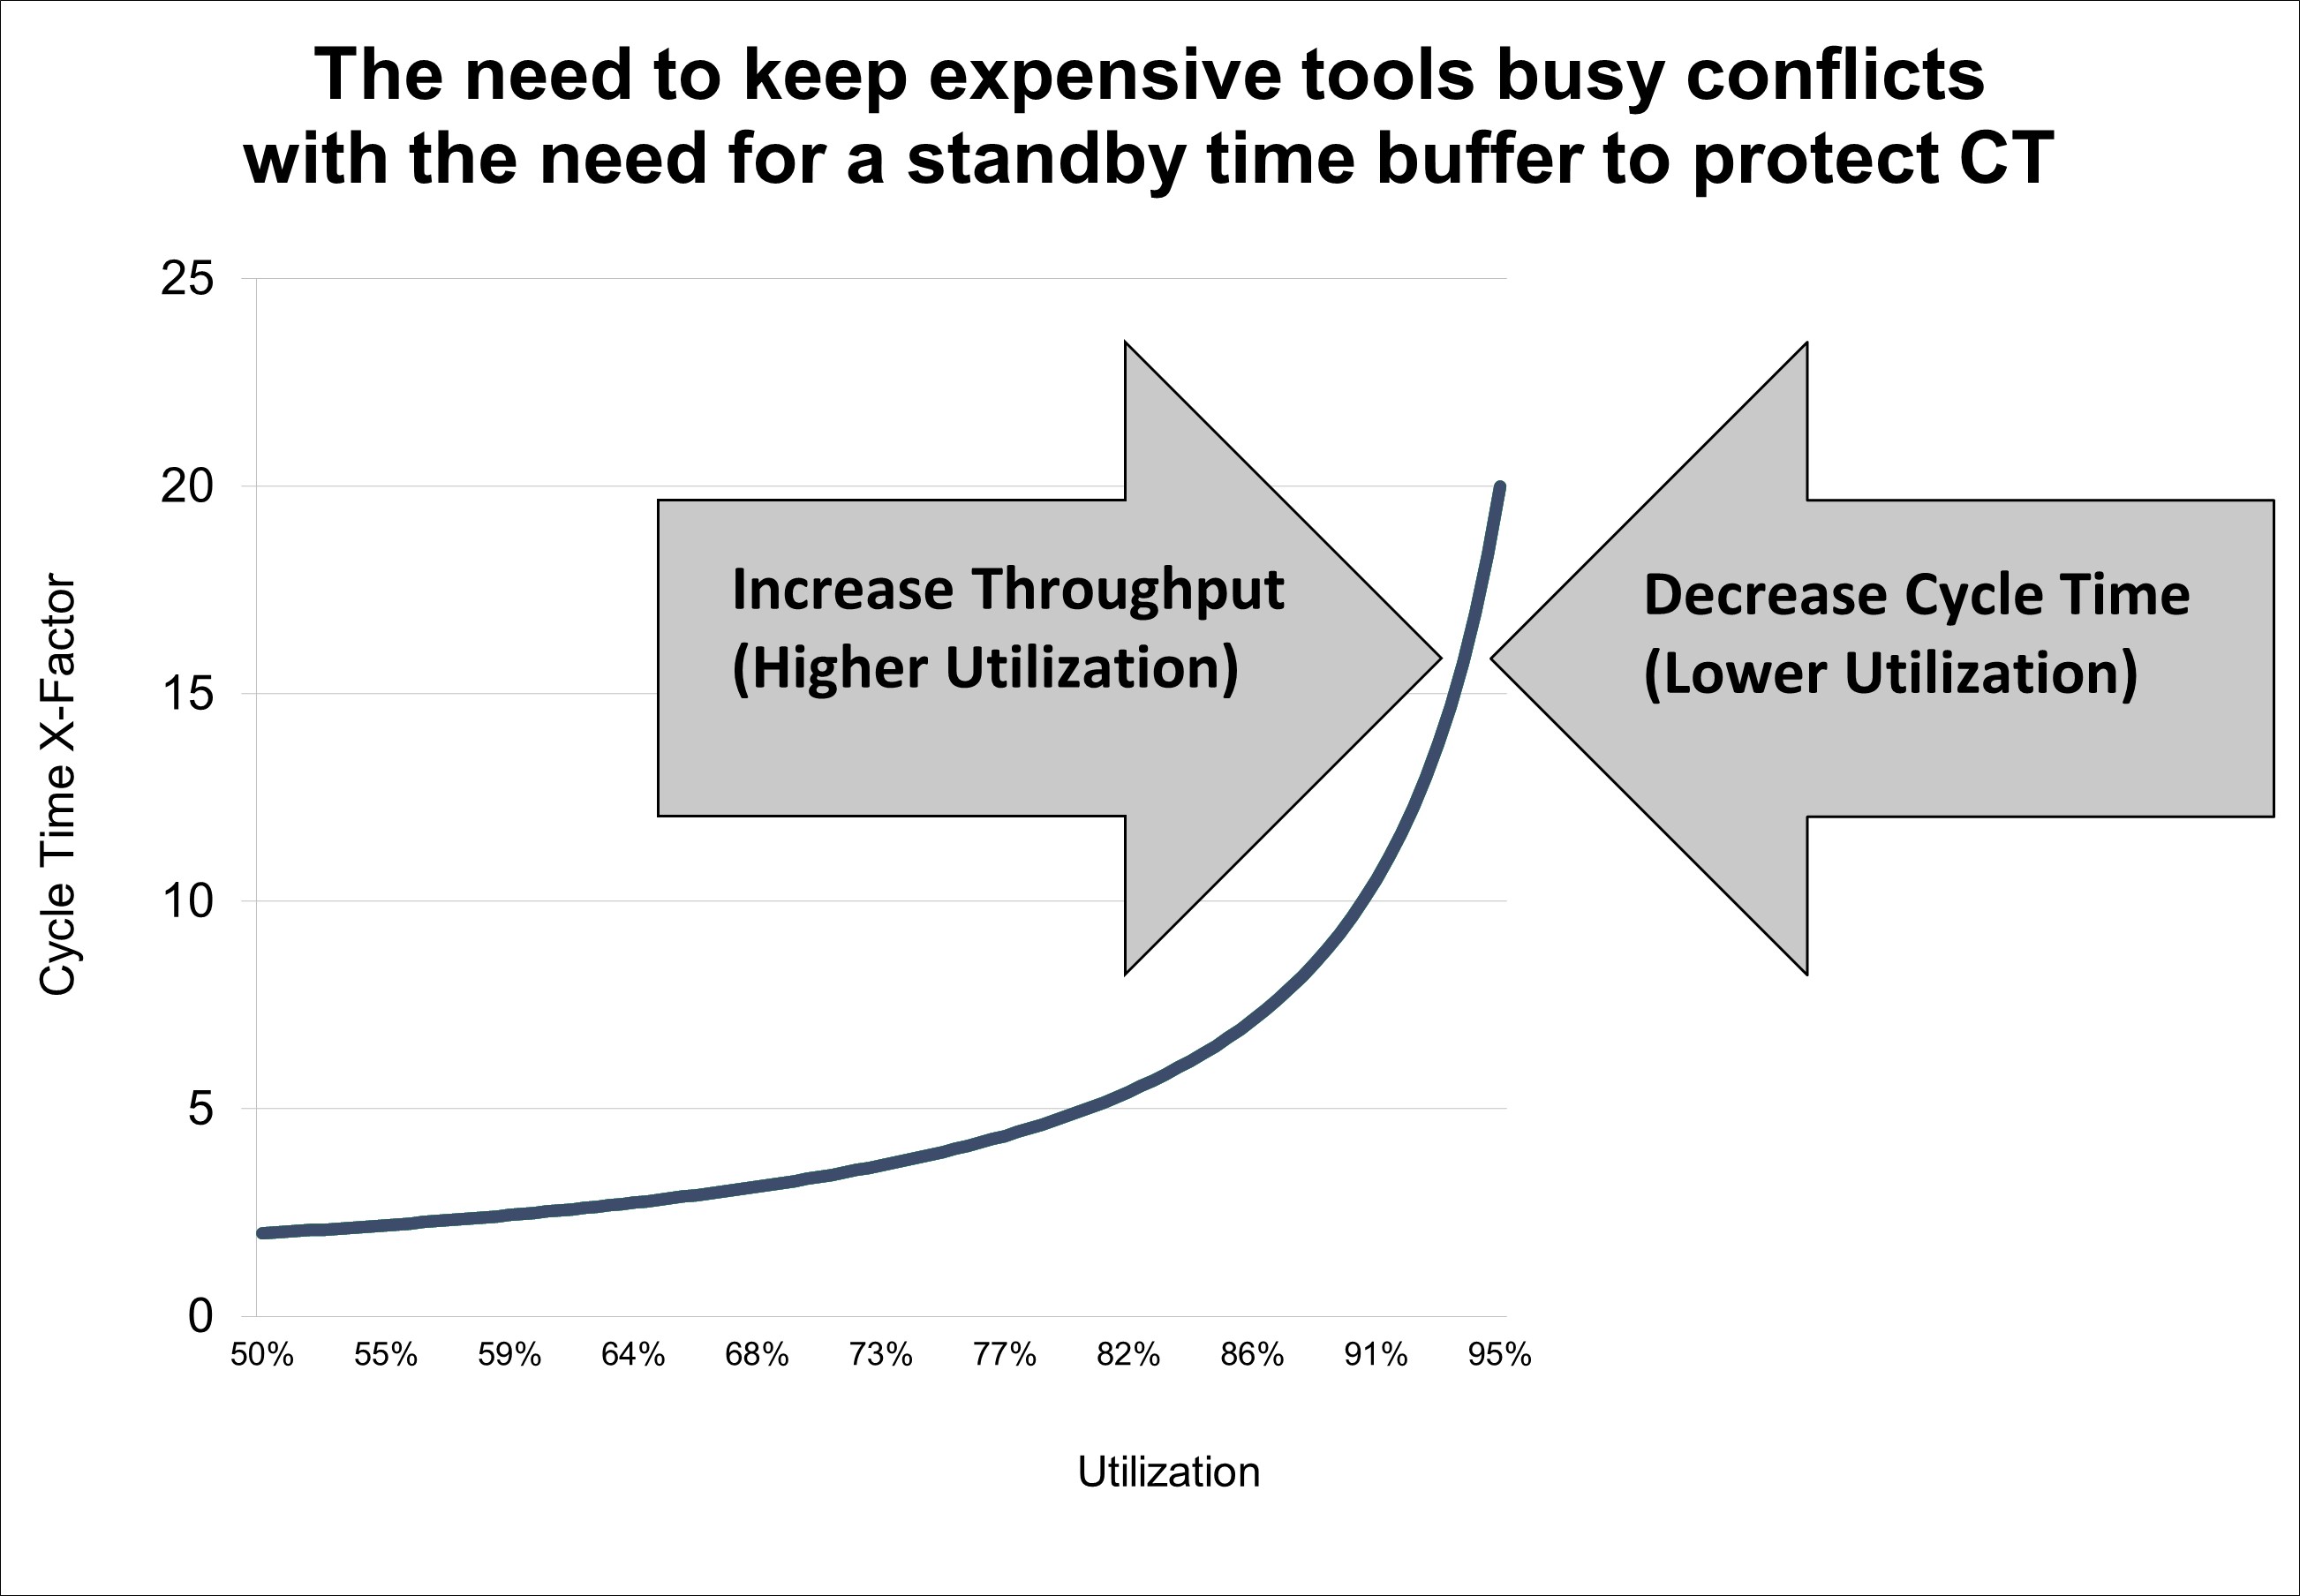
- The most expensive EUV tools cost $200M each. Even “less expensive” legacy tools can cost $5M to $10M.
- Fab managers are under pressure to keep these expensive tools busy! This results in high tool utilization (which we know drives high cycle times).

- Wafer fab process flows are long and complex. Products today can have close to 100 layers, and more than 1000 process steps. This introduces a LOT of variability, which, of course, increases cycle time.
- Product and technology mix change rapidly. This means that:
- Process engineers may not be able to qualify new recipes on enough tools.
- Tools on the bleeding edge of technology may be unreliable because they’re new.
- Legacy tools may be unreliable because they’re worn out, and it’s either technically infeasible or cost-prohibitive to replace them.
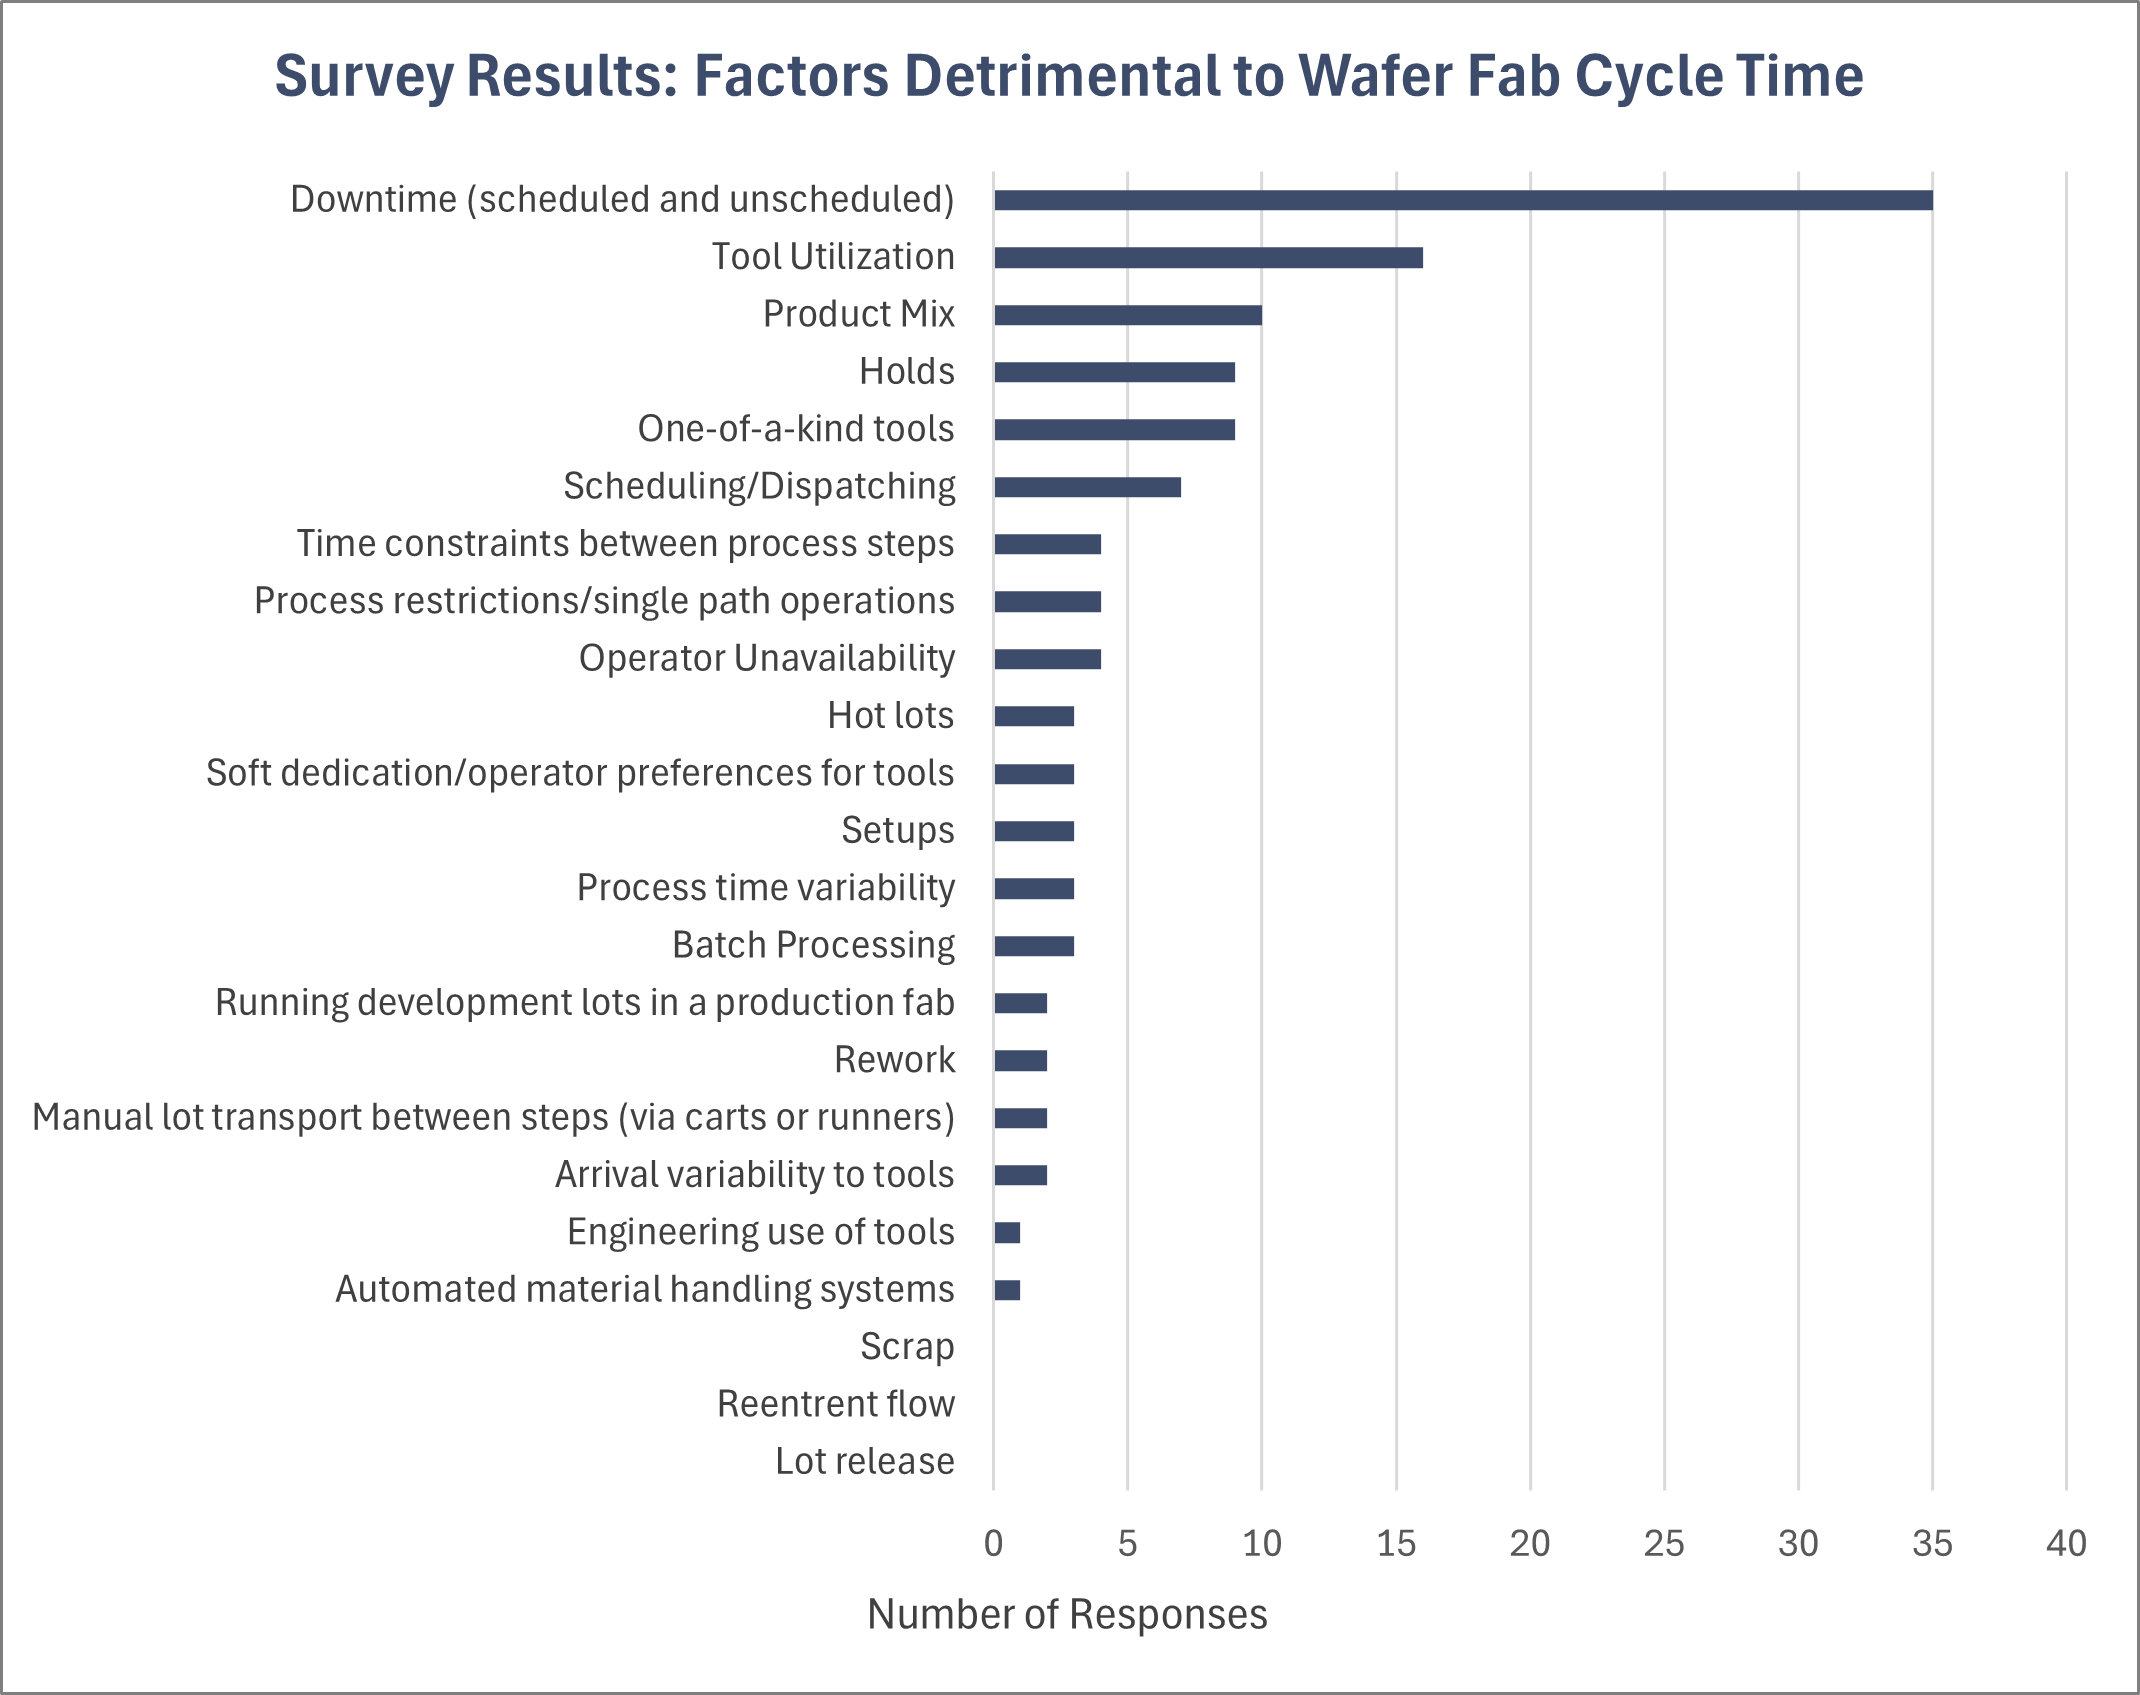
For 25 years, I’ve been asking people some variant of this question: “Why is cycle time high in your fab?” Respondents have cited many detailed reasons. For a year or so, we asked people who subscribed to this newsletter to choose what they believed to be the top contributor to fab cycle time from a list of options. Results from 123 respondents are aggregated below. (See Issue 24.04: Commonly Reported Wafer Fab Cycle Time Contributors for more information.)
It’s worth noting that some of the factors in the above list are fab-specific (time constraints between process steps, reentrant flow) while others apply to factories in general. What is undeniable is the fact that achieving great cycle time in a wafer fab is challenging (particularly when high demand is driving high utilization).
, updated to fix a previous error.")
So, what can you do? How should you begin if you want to improve cycle time in your fab?
We know that improving wafer fab cycle time is financially beneficial and helps make running the fab easier. The next question is: how should we go about it?
I propose a three-step process, as shown below.

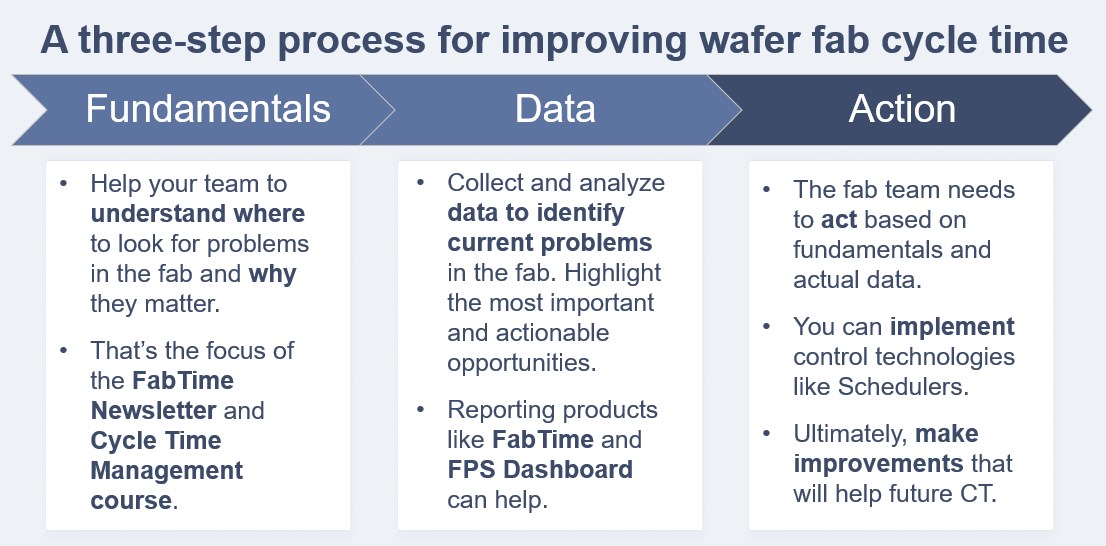
Fundamentals: The first step is to help your team understand where to look for problems and why. That’s the focus of this newsletter and our cycle time class. If we don’t understand how factories work, it’s easy to make mistakes that degrade performance. These might include starting too many wafers, introducing too much variability, or letting a lack of operator or technician cross-training constrain your performance.
Data: The second thing that we need to improve fab cycle time is data. We need to be able to see and prioritize the current problems in the fab so that we can focus on the ones that offer the highest leverage. This data needs to be proactive. It’s not enough to know what problems did occur (though there can be valuable learning in that). We want to know what problems we can tackle today that will help us to improve cycle time in the future.
Action: We can spend as much time as we like learning about factory physics and collecting data about what’s going on in the fab. If we don’t take any action, we will not see any improvement. Actions to take may include:
- Purchasing tools and hiring people.
- Making operational changes (batch tools, PM schedules, etc.) to reduce variability or free up buffer capacity.
- Implementing control technologies like schedulers and other Smart Manufacturing solutions.
What matters is taking some form of action. Ideally, we can measure performance before and after acting, to see what works best in a given fab.
What resources are available to help?
Fundamentals: Several resources for understanding fab cycle time fundamentals are available from the INFICON website, including:
- Past issues of the FabTime Newsletter in PDF format. Subscribers can download individual issues or a full archive. There is also a PDF file containing the abstracts from all newsletter issues to date. Existing subscribers can find the archive link in your most recent email newsletter. New subscribers will see the link upon registering.
- The FabTime Operating Curve Spreadsheet, a useful Excel-based tool for exploring tradeoffs related to variability, utilization, and number of qualified tools.
- Information about the FabTime Cycle Time Management Course, a four-hour Teams-based course to help your team to understand the fundamental drivers of wafer fab cycle time.
- A PDF file containing a tutorial on wafer fab cycle time as well as various queueing formulas, created back in the early days of FabTime.
- A video of my FOA Fab Star Webinar on the fundamental drivers of fab cycle time. Follow this link and scroll to the bottom of the page to watch.
Data: The INFICON FabTime and Factory Dashboard software products were both designed to give people who work in wafer fabs access to the data they need to make improvements. Examples include:
- Operation cycle time data by tool group, as well as hours of WIP waiting for each tool group. Both of these charts highlight the tools that are contributing the most to cycle time right now. Making improvements at these tools can improve future cycle time.
- Dynamic cycle time and dynamic x-factor, which both give a forward look at cycle time, so that problems can be corrected now, before lots ship late.
- Standby-WIP-waiting time and post-process time by tool group, which can be an indicator of staffing constraints.
- Current equipment status and upcoming scheduled maintenance, so that engineers can be deployed appropriately.
Action: One way to take action towards cycle time improvement is to add capacity and/or staff. This approach is not always feasible, of course. However, there are many actions that you can take to reduce variability in your fab, and to make the fab run more effectively. These actions include changing operating practices and using smarter software tools.
- Several articles from the FabTime Newsletter feature suggestions for changes in operating practices, including:
- A Fab Cycle Time Improvement Framework (Issue 23.06)
- 10 Recommendations for Fab Cycle Time Improvement (Issue 22.02)
- 10 More Recommendations for Improving Fab Cycle Time (Issue 24.01)
- Many fabs are moving from standard dispatching to smart scheduling. The INFICON Factory Scheduler uses advanced heuristics, linear programming, optimization, and intelligent search algorithms to generate real-time optimized schedules for your fab. The integrated NextMove product provides direction to material handlers and operators on the floor.
Conclusions
There are clear financial and qualitative benefits to reducing wafer fab cycle time, although structural realities in the fab environment make this difficult. Expensive tools, complex process flows, and high levels of product mix result in high utilization and variability and insufficient tool redundancy. We believe that a three-pronged approach is necessary to improve fab cycle times. Fab teams need education to understand where to look for problems and why. They also need flexible access to data that highlights both current and future problems. Finally, they need to act, whether by expanding capacity and staffing, making changes to operating practices, or adding software control technologies. We’ve included links to resources that we offer in these areas and look forward to the opportunity to help.
Acknowledgements
Thank you to the many individuals who have actively participated in sessions of our cycle time management class. We learn something new from every group, and that increasing knowledge base has informed this article.


Want to learn more about cycle time drivers in your fab?
