Factory Operations Optimization
Digital Twin Enabled Smart Scheduling and Operations Optimization

Reset the filters to get results.
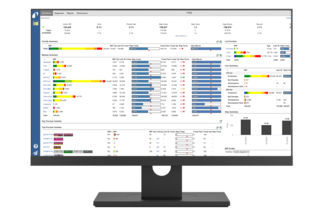
The Factory Digital Twin is the most critical building block for developing a Smart factory. It collects all the real-time operations events to compute cycle time and throughput data to drive powerful applications.
- Provides a universal platform to which production data can be loaded from multiple resources.
- Facilitates translation of data into information, thereby driving the function of all connected solutions.
- Central and foundational core of Smart Manufacturing

The Factory Dashboard is the principal operations reporting tool used by industry-leading fabs around the world.
- Enables quick response to machine and WIP issues
- Increases all factory personnel awareness
- Improves reaction time of personnel
- Improves alignment of operations with planning
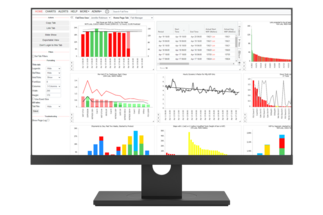
Analyzing Tool States and Idle Time to Identify Capacity Bottlenecks
- Designed for all levels of management
- Easily extract MES data for reporting
- 165+ Predefined reports and highly configurable
- No code business intelligence tool
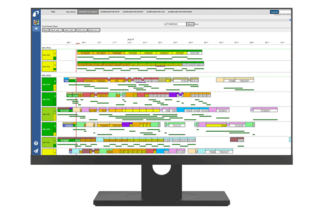
Factory Scheduler utilizes Advanced Heuristics, Linear Programming, Optimization, and Intelligent Search Algorithms to generate a real-time optimized schedule that can be easily tuned to meet your manufacturing needs.
- Calculates and conduct a full schedule of lots running on tools
- Comprehends area-specific constraints and objectives
- Manages queue timers, maintenance windows, cluster tools, etc.
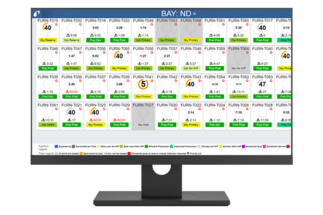
Provides straightforward instructions to operators and material handlers on the factory floor.
- Integrates the optimal lot level solutions created by the FPS Scheduler
- Visual aides to inform Operators when the tools in their area will go idle
- Directs material handlers to get the lots to the right place at the right time to ensure optimal tool utilization
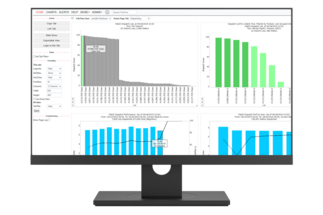
Enhancing Tool Dispatching Efficiency
- Industry standard dispatch rules
- Improve delivery and report on performance
- Easy to use
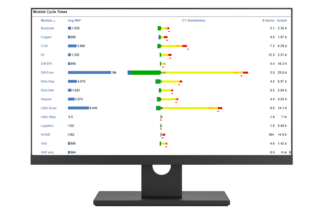
Leverage the historical operational data in the Digital Twin to create previously unavailable insight into Cycle Time losses.
- Easy to navigate cycle time website available to anyone on the company intranet.
- The individual components of cycle time (queue time, process time, post process time) are broken down visually.
- Components of cycle time can be compared by product, by module, or by step within the product flow.
- Charts showing average WIP levels allow you to see the interactions between WIP and cycle time.
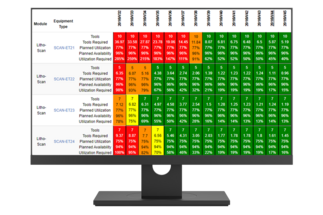
Creates estimates of tool utilization for given starts profiles using precise factory data.
- Enhanced material movement modeling
- Granular cycle time contributions by product, by module, or by step within the product flow
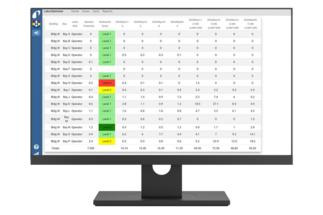
Optimally assign team members in the factory based upon current and future workloads.
- Automatically determines the optimal assignment of shift team members
- Consider certifications and skill sets
- Capture historical operating staffing and performance
- Provide critical real-time visualization of staffing
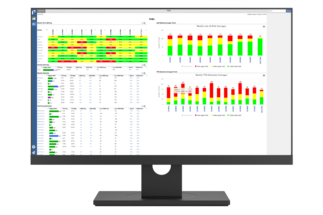
Supporting the Autonomous Driving Zero Defect Challenge - World’s First Smart Integrated Sampling Management System
- User defined rule set to manage sampling objectives
- Integrates with clients MES and tags inventory
- Minimize the amount of material being measured while maintaining coverage and managing excursions
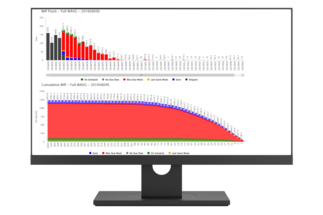
Predict your factory shipments based on current and historical factory states, broken down by future weeks.
- Model factory output
- Provide supprort for multiple facilities and complicated manufacturing flows
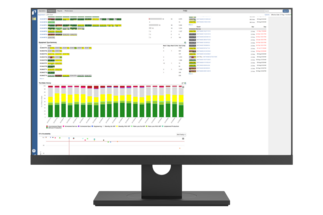
Enhanced Tool Performance (ETP) state logic combines traditional E10 tool centric data with WIP States to provide a comprehensive view of fab operational losses not visible with traditional reporting.
- Detailed state analysis that exceeds the standard E10 Semi state model
- Increased ability to identify manufacturing loss