10 More Recommendations for Improving
Fab Cycle Time
Concrete operational recommendations for wafer fabs to improve cycle time and productivity

We offer in this article ten more recommendations for improving fab cycle time, following up on the earlier article 10 Recommendations for Improving Fab Cycle Time. These suggestions are distilled from the FabTime team's experience and our cycle time management course
- Focus on reducing total duration of unscheduled downtime events instead of on increasing mean time between failures.
- Measure the variability of availability, not just average availability. Work daily to minimize the former and maximize the latter.
- Understand your fab's x-factor, both overall and by operation or tool group.
- If you break large tool groups into smaller groups, ensure that any sub-group has at least three tools.
- When you analyze standby time for constraint tools, separate out the time when qualified WIP is waiting.
- Implement policies to keep tools running across shift change.
- Don't put lots on hold for non-process-development reasons (down tools, to speed them up, etc.).
- If you can't avoid future holds completely, make sure you have more than one person alerted for them.
- Make sure your lower bound on the number of hot lots in the fab is zero.
- Log more detailed WIP transactions, including automated end run transactions.


Focus on reducing total duration of unscheduled downtime events instead of on increasing mean time between failures.
What affects cycle time is not how frequently tools go down (to a point, at least), but rather how long they are unavailable when they do go down. This is particularly true for one-of-a-kind tools. Anyone who has worked in a fab, particularly a smaller or older fab, knows how painful it is to have a key tool unavailable for days at a time. WIP bubbles pile up, causing operational problems that last much longer than the downtime event itself. Rather than focusing on the mean time between failures, we recommend driving for high overall availability (see below) while reducing the duration of downtime events. A good metric to use for this is Green-to-Green (G2G), which measures the total time from when the tool becomes unavailable until it is available once again, grouping together any sub-states like waiting for technician or waiting for parts. See Issue 22.01: On Breaking Up PMs and Other Unavailable Periods for details about downtime duration and G2G.
Measure the variability of availability, not just average availability. Work daily to minimize the former and maximize the latter.
Increasing tool availability is a well-known key to improving fab cycle times. Whenever unavailable time is converted to standby time on a given tool, that tool has more of a buffer to recover from variability. Improving availability on key tools helps fabs to move away from the steep part of the operating curve and achieve lower cycle times. Improving availability can also help fabs to increase throughput and become more profitable, though that is not our primary topic today.
For fabs that are focused on cycle time improvement, it makes sense to move beyond focusing on average availability to also consider the variability of the availability itself. We don’t just want tools with high average availability over the course of the year. We want tools that can be relied upon day-to-day and shift-to-shift to be available when they are needed.
Availability variability can be measured using:
- Coefficient of variation of the availability (shown below);
- Coefficient of variation of repair times or of G2G times; or
- A proxy metric like A20/A80.

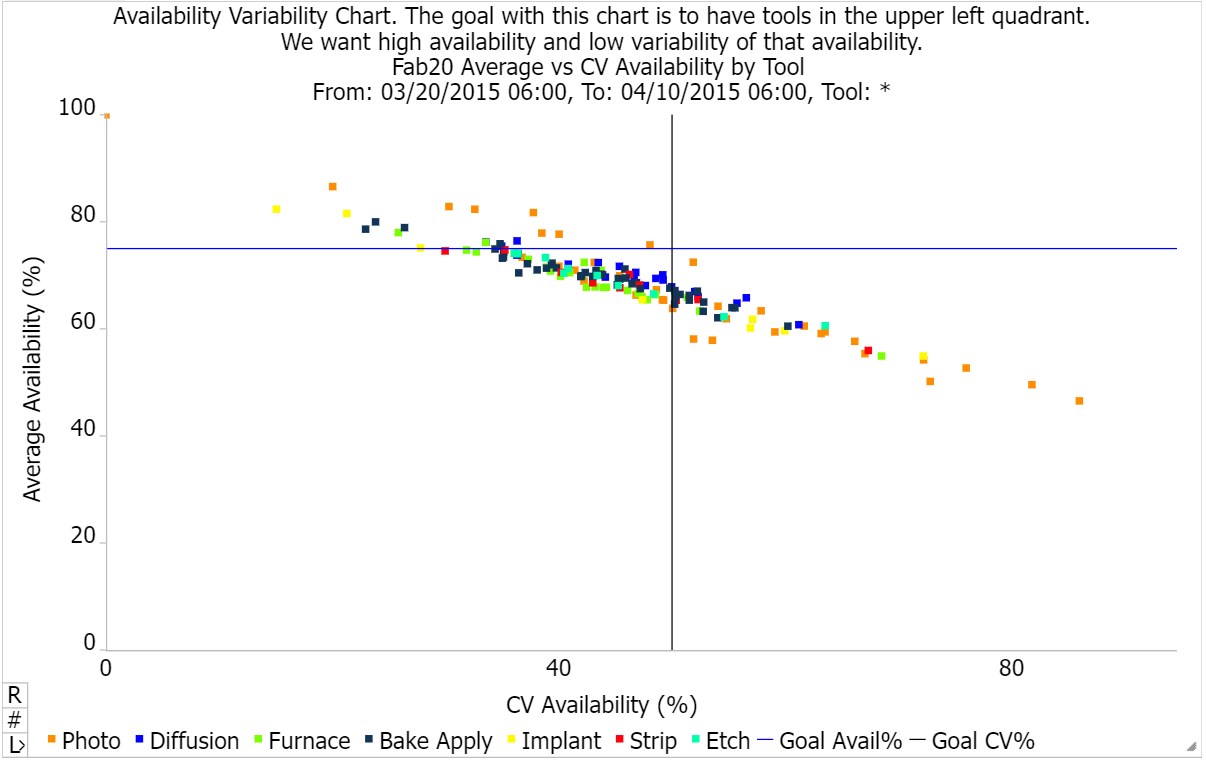
The important thing is to track something, ideally in a visual way that captures not just average availability but variation in availability from tool-to-tool and from day-to-day. An example of a quadrant chart showing availability variability is shown above. The more you can reduce availability variability, especially for bottleneck tools, the better your overall cycle times will be. Note also that even on lower-utilization tools, availability variability sends arrival variability downstream. When the tool comes back up from a long downtime, a big burst of WIP is sent to previously starved downstream tools.
Understand your fab’s x-factor, both overall and by operation or tool group.
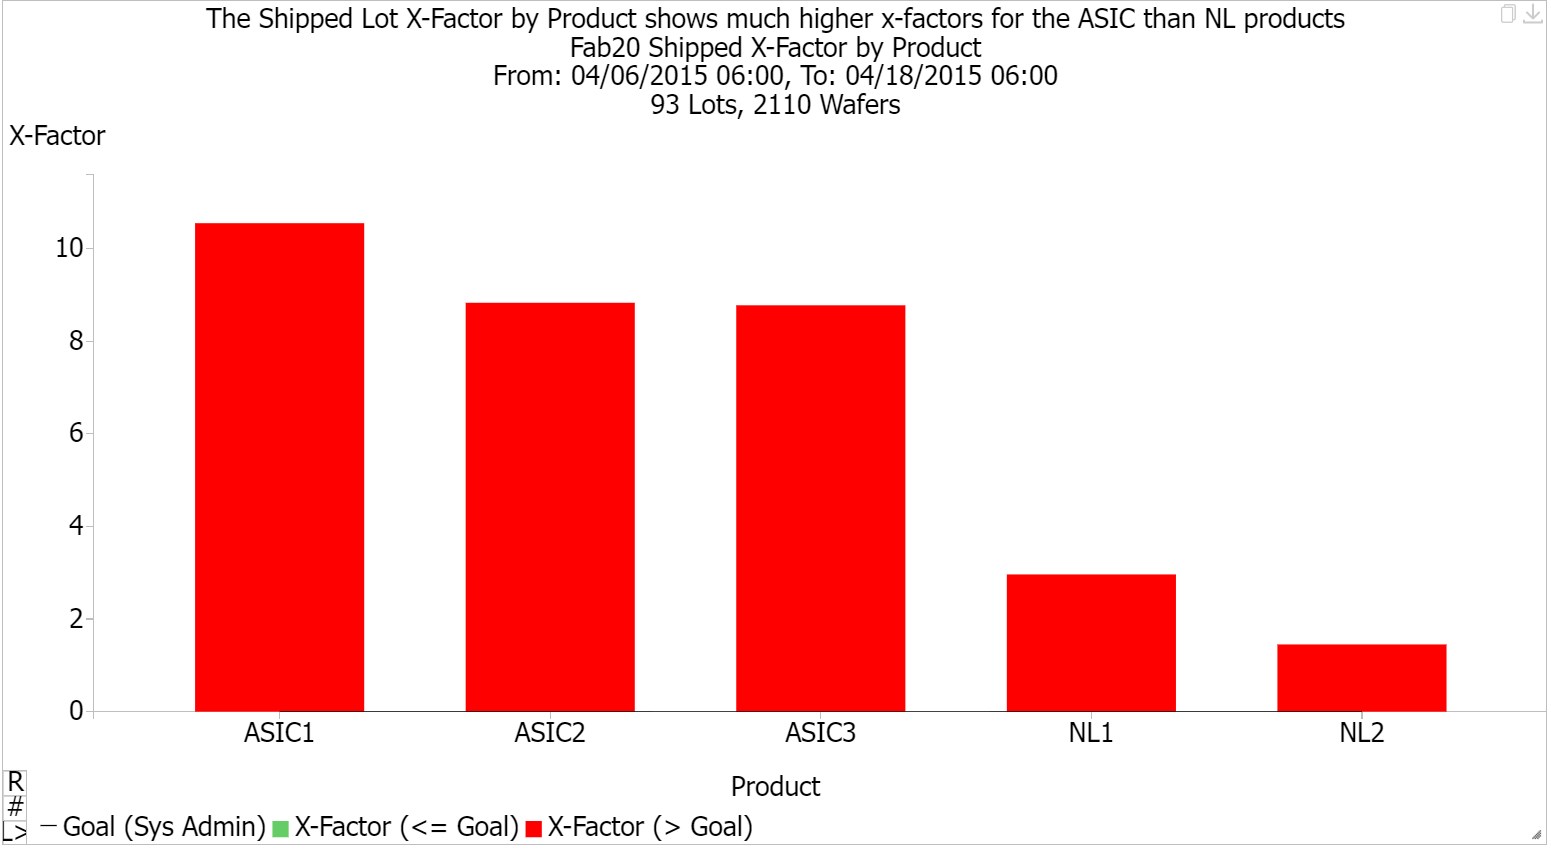
If you want to improve a fab’s cycle time, it helps to understand how much improvement opportunity is available. FabTime has long recommended the use of X-Factor (total cycle time / theoretical cycle time) to track cycle time performance. An example of a Shipped Lot X-Factor chart from FabTime is shown below. We particularly encourage fabs to use Dynamic X-Factor, which can give a forward look at expected X-Factor without requiring access to theoretical cycle time data. X-factor is also useful at the operation level, aggregated by tool group, to identify the tools that, on a short-term basis, are contributing the most to cycle time.

If you break large tool groups into smaller groups, ensure that any sub-group has at least three tools.
Some fabs that have large tool groups break them into smaller sub-groups, with the tools in each group running similar recipes. This can be helpful in reducing setups as well as reducing process time variability. However, it is important if you do this to ensure that any sub-group has at least three, or preferably four, tools in the group. This is because tool groups with only one or two tools have significantly higher average cycle time per visit. See Issue 20.05: The Impact of Tool Qualification on Cycle Time. It’s also important to ensure that the average utilization across the sub-groups is consistent. We don’t want to create two sub-groups, one with average utilization of 75% and the other with average utilization of 95%. The latter will have much higher cycle times than necessary, outweighing any benefits from reduced process time variability.
When you analyze standby time for constraint tools, separate out the time when qualified WIP is waiting.
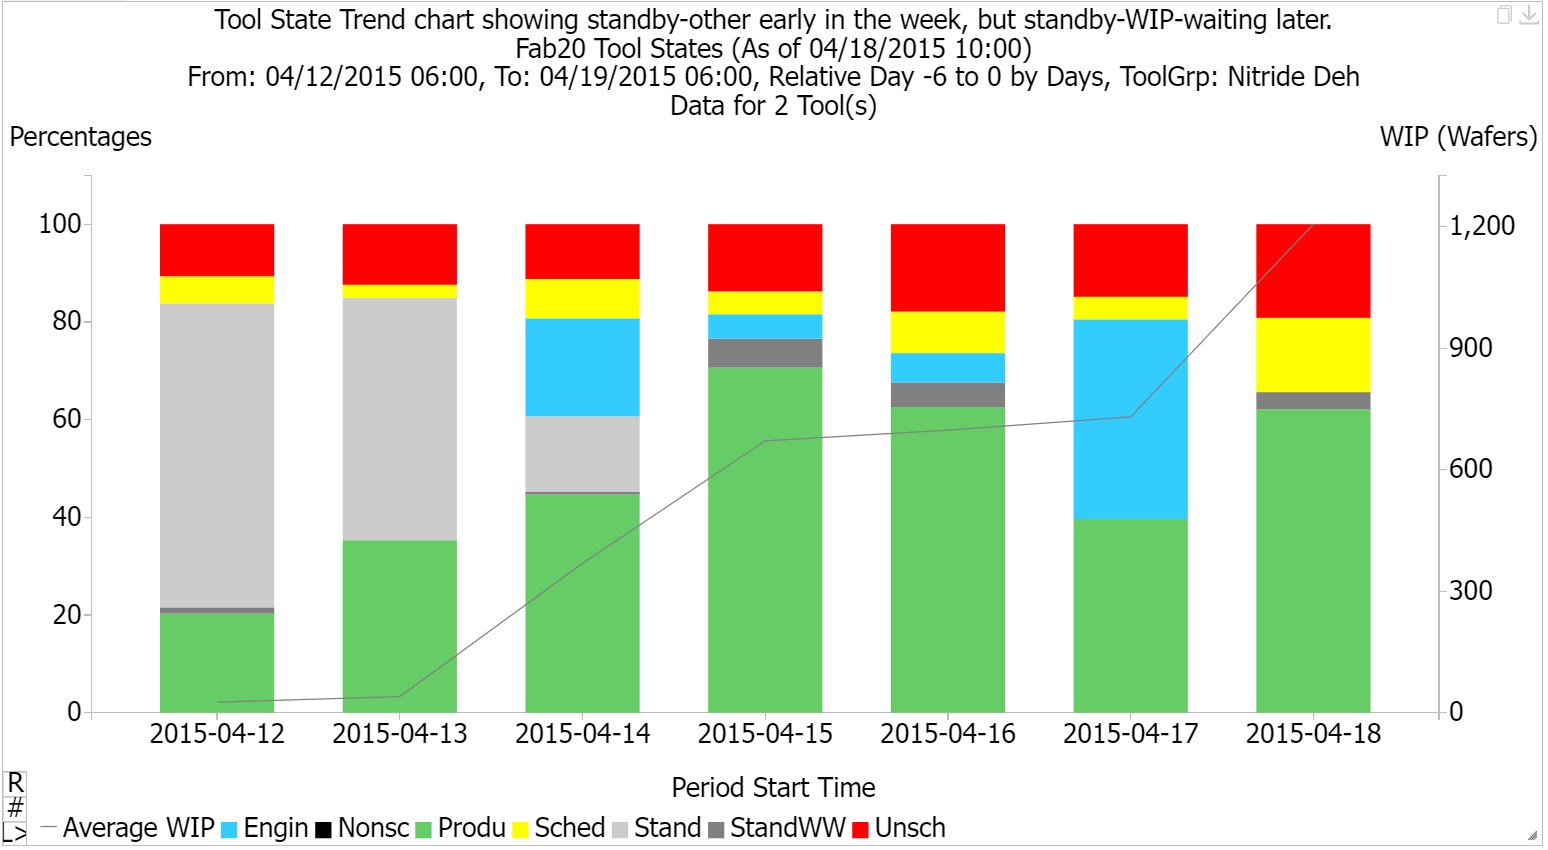
The idea here is that not all standby time is created equal. Sometimes a tool will display as being in a standby state while there is qualified WIP waiting in front of the tool. In the FabTime reporting module, we call this Standby-WIP-Waiting. We report it separately from Standby-Other (time when the tool is available but is not running because there is no WIP to run). Standby-WIP-Waiting time is not buffer capacity that can be used to recover from variability. Instead, Standby-WIP-Waiting time represents a capacity loss, forced idle time on a tool. Often, it occurs because there is no operator there to load the tool, though there can be other causes such as WIP staging. Identifying Standby-WIP-Waiting time when it occurs on constraint tools is a first step in reducing it and improving cycle time. The chart below the SEMI E10 Tool States for a tool group by day over a week. This example shows that the WIP (the gray line) increases as the Standby-Other is replaced by an interval with only Standby-WIP-Waiting (the dark gray).

Implement policies to keep tools running across shift change.
Shift changes can be a hidden source of forced idle time on tools. When tracking moves, there is an incentive to finish short production runs toward the end of a shift. This may mean that tools are left idle at shift change, because the incentive is to track work out of tools, not to keep tools working. This leads to low moves at the start of the next shift. We worked several years ago with a customer site to implement a metric called Earned Plan Hours (EPH).
")
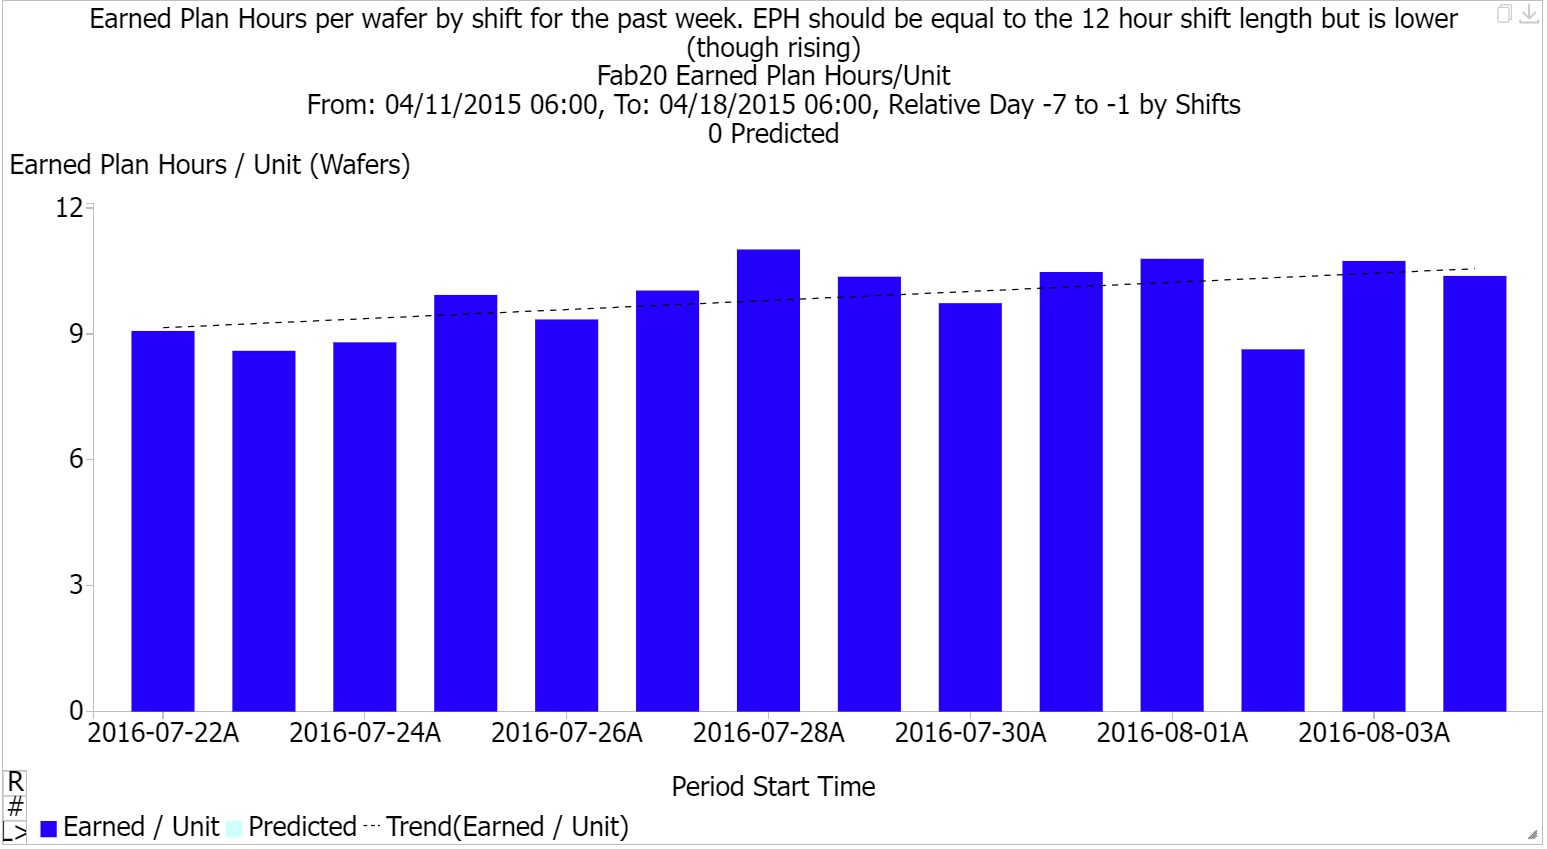
The EPH metric attempts to counteract undesirable behavior by giving credit when lots are tracked into tools, and as processing occurs on tools. When a lot is tracked into a tool, credit is given for the planned queue time of the lot at its current flow/step. As a lot is processed, credit is given for elapsed processing time, up to the end of the planned process time or shift change, whichever comes first. EPH per wafer should always equal the shift length if things are going according to plan. If less, as shown in the example above, the factory is falling behind. Fabs can also use Dynamic X-Factor to identify shifts or areas that do a better job than others keeping WIP running over shift change.
Don’t put lots on hold for non-process-development reasons (down tools, to speed them up, etc.).
Engineering holds may be unavoidable for fabs developing new processes. We have learned from discussion with many fabs, however, that it is not uncommon to put lots on hold for reasons other than process development. Sometimes a lot is put on hold because the only tool that can be used to process it is down waiting for parts, or because a reticle is unavailable. There are two problems with this practice. First, it hides the true reason for the lot’s delay. We won’t know from the data that better spare parts or reticle management policies might have avoided the delay. The second problem is that we may not have policies that automatically take the lot back off hold when the tool or reticle or whatever is available. Lots can thus spend more time on hold than they need to. It’s our recommendation that lots not be put on hold when the hold masks the true reason for the delay. We have even heard of cases where fabs put lots on hold to draw attention to them, with the goal of speeding them up. This seems counter-productive to us and is not recommended.
If you can’t avoid future holds completely, make sure you have more than one person alerted for them.
Another phenomenon that we’ve observed is the “future hold.” This is when an engineer specifies that a lot be placed on hold when it reaches some future step. These future holds may again be unavoidable for process reasons. The problem with them is that when the future hold arises, the engineer who placed the hold might not be available. Engineers are people, not tools. They don’t work 7x24. They go on vacation. They get sick. Therefore, our recommendation is that fabs establish a policy that any future hold has a designated backup engineer who can disposition the lot and get it moving again. The alert function in the FabTime reporting module can help with notification of the primary and back-up engineer.
Make sure your lower bound on the number of hot lots in the fab is zero.
This tip was inspired by a newsletter subscriber, who reported that people on his or her team “would like to put a fictional priority on lots that are not late in order to increase the quantity of priority WIP closer to (the fab target of) 10%.” We’ll just say here that while hot lots may be necessary, they are not free. They increase variability in the fab, and thus drive up cycle time. While target upper bounds for hot lots can vary (usually between 5% and 10%, except in special cases), the target lower bound on the number of hot lots in a fab should be zero.
Log more detailed WIP transactions, including automated end run transactions.
Another hidden source of forced idle time on tools occurs in less automated fabs, when the tools do not send an automatic signal when a lot finishes processing. The lot appears as “in process” in such fabs’ systems until the operator logs a move out transaction. For fabs that are operator-constrained, this time can be significant. This causes the reported process time to be inflated and reduces the standby time that the tool can use to recover from variability.
Dynamic X-Factor charts will also be less accurate where this occurs, meaning that projected cycle times from DXF will be biased low. In general, more detailed logging of WIP-related transactions (automatically recording end run transactions, differentiating between move out transactions at one step and arrival transactions at the next, and differentiating between arrival and begin run transactions) enables better understanding of lot cycle times and highlights opportunities for improvement. This item is last on the list not because it isn’t important but because it is relatively difficult to implement.
Conclusions
Even after many years working in the industry, we are still learning about painful complexities and quirky behaviors in fabs. The upside of that is that there are many things that we can recommend that people in fabs do, or stop doing, to improve cycle time. We summarized ten of these ideas in a previous article and were inspired to share ten more here. Every fab is on a different place in their journey to understand and improve cycle time. Each of these tips will be more relevant for some fabs, and less relevant for others. But it is our hope, if you have taken the time to read this far, that you have found some tidbit that will be useful for you. As always, we welcome your feedback (and your tips for improving fab cycle time!).

