New Metric: Cycle Time Impact of Hot Lots
Addressing the details of a new metric for capturing the impact of front-of-the-line hot lots on regular lot cycle time
This article introduces a new Hot Lot Cycle Time Impact metric, which captures the impact of front-of-the-line hot lots on regular lot cycle time. We include brief examples to show how the process time of a front-of-the-line hot lot adds to the queue time of all lots already in queue. We then expand on these examples to demonstrate the validity of this metric for tool groups with multiple tools and for situations with multiple lots delayed.
Background
Hot lots are a known contributor to fab cycle time. Although there are many types of hot lots in wafer fabs, they are typically classified into two primary categories: hand carry lots and front-of-the-line hot lots.
Hand carry lots are the highest priority of hot lots. They may be preemptive and require operators to break setups. Often tools are held idle in advance of these lots so that the hand carry lots never have to wait. Hand carry lots are generally very limited in quantity. Often a single person (per shift) is responsible for each hand carry lot as it moves through the fab. The impact of hand carry lots on fab cycle time is difficult to quantify because it depends on the details of each fab’s operational policies (How many steps ahead do you hold tools? Do you break setups?). Even simulation models can’t accurately capture the impact of hand carry lots because their occurrence is so case-specific.
Front-of-the-line hot lots (also called regular hot lots) are lots that are given a higher priority than others for dispatching. These lots are non-preemptive and do not require breaking setups or holding tools idle. They are sometimes stored in different-colored lot boxes to make them easier to identify. There may be multiple sub-classes of front-of-the-line hot lots (e.g. priority 0080, 0085, 0090, etc.).
It is possible to use a queueing formula to estimate the impact of front-of-the-line hot lots on the cycle time of regular lots. The approximation we use is discussed in the FabTime Cycle Time Management Course and is included in our Operating Curve Spreadsheet. However, as with all queueing formulas, the approximation is best used as an estimate of long-term, average impact.
A prospective customer requested a chart in FabTime that could show the actual impact of front-of-the-line hot lots on the cycle time of lots already in queue. They wanted this information so that they could show management the cost (in cycle time) of ever-increasing quantities of hot lots. We didn’t have a standard chart for this, but we thought it was a useful insight to capture, so we implemented a new Hot Lot Cycle Time Impact List chart. To calculate front-of-the-line hot lot cycle time impact, FabTime does the following:
Step 1. Generate a list of Arrivals within the chart date range, for hot lots with the specified PriorityClass filter.
- Any lots with ToolGroup=Undefined are excluded from this list.
- Lots not matching the specified PriorityClass filter are assumed to be non-hot lots. (Note: these lots could be lower-priority hot lots, as long as the lots in the specified PriorityClass jump ahead of them.)
Step 2. For each hot lot Arrival, search for the corresponding BeginRun with timestamp on or after the Arrival at the same Operation/Step.
- It is assumed that BeginRun transactions will always be preceded by an Arrival transaction.
Step 3. For each hot lot BeginRun, find the time of the subsequent BeginRun for any lot at the same ToolGroup.
Step 4. For each hot lot, find any non-hot lots that were in queue for the same ToolGroup at the time of the hot lot Arrival, and that have not had a BeginRun prior to the hot lot BeginRun.
Step 5. Approximate the delay of each of the non-hot lots as the delta between the time of the hot lot BeginRun and the time of the subsequent BeginRun (for any lot at the same ToolGroup).
- Argument: The hot lot jumped ahead of the non-hot lots, thus delaying each of them. Each lot that arrived prior to the hot lot could possibly have started processing when the hot lot started processing but was delayed at a minimum to the subsequent BeginRun time.
Before showing examples from FabTime’s software, let’s work through some numerical examples that illustrate the approach taken for this metric.
Example 1: Single Tool, Single Lot Delayed
For our first example, assume in the chart below that Lot1 and Lot2 are non-hot lots, and Lot3 is a hot lot.

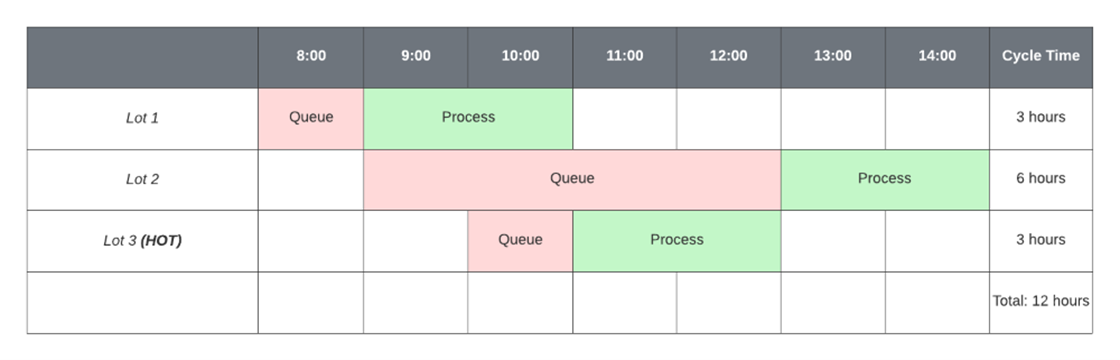
- At 08:00, Lot1 arrives at Step1 (ToolGroup1).
- At 09:00, Lot1 begins running on Tool1. Lot2 arrives at Step1 (ToolGroup1).
- At 10:00, Lot3 (hot) arrives at Step1 (ToolGroup1).
- At 11:00, Lot1 completes running on Tool1. Lot3 (hot) begins running on Tool1, jumping ahead of Lot2.
- At 13:00, Lot3 (hot) completes running on Tool1. Lot2 begins running on Tool1.
- At 15:00, Lot2 completes running on Tool1.
In this example, Lot2 is delayed by two hours due to Lot3 (hot). This delay is computed as the delta between Lot3’s BeginRun (11:00) and the time of the subsequent BeginRun for Lot2 (13:00). Note that had Lot3 not been a hot lot, those additional two hours of queue time would have accrued to Lot3 instead of Lot2. Lot2 would have had a four-hour cycle time and Lot3 a five-hour cycle time. In both cases, the average cycle time is 4 hours (12 total hours divided by three lots). Front-of-the-line hot lots in general don’t increase average cycle time. They just reallocate queue time from the hot lot to the regular lots. (Exceptions can occur if front-of-the-line hot lots cause smaller batching or extra setups.)
Example 2: Single Tool, Multiple Lots Delayed
As a second example, consider the expansion of the above scenario to four arriving lots to a single tool. At the top of the chart below, we see the sequence of queue and process times that would occur if none of the lots were hot, and the lots processed in first-in-first-out order. The total cycle time incurred is 18 hours (4.5 hours/lot, on average).

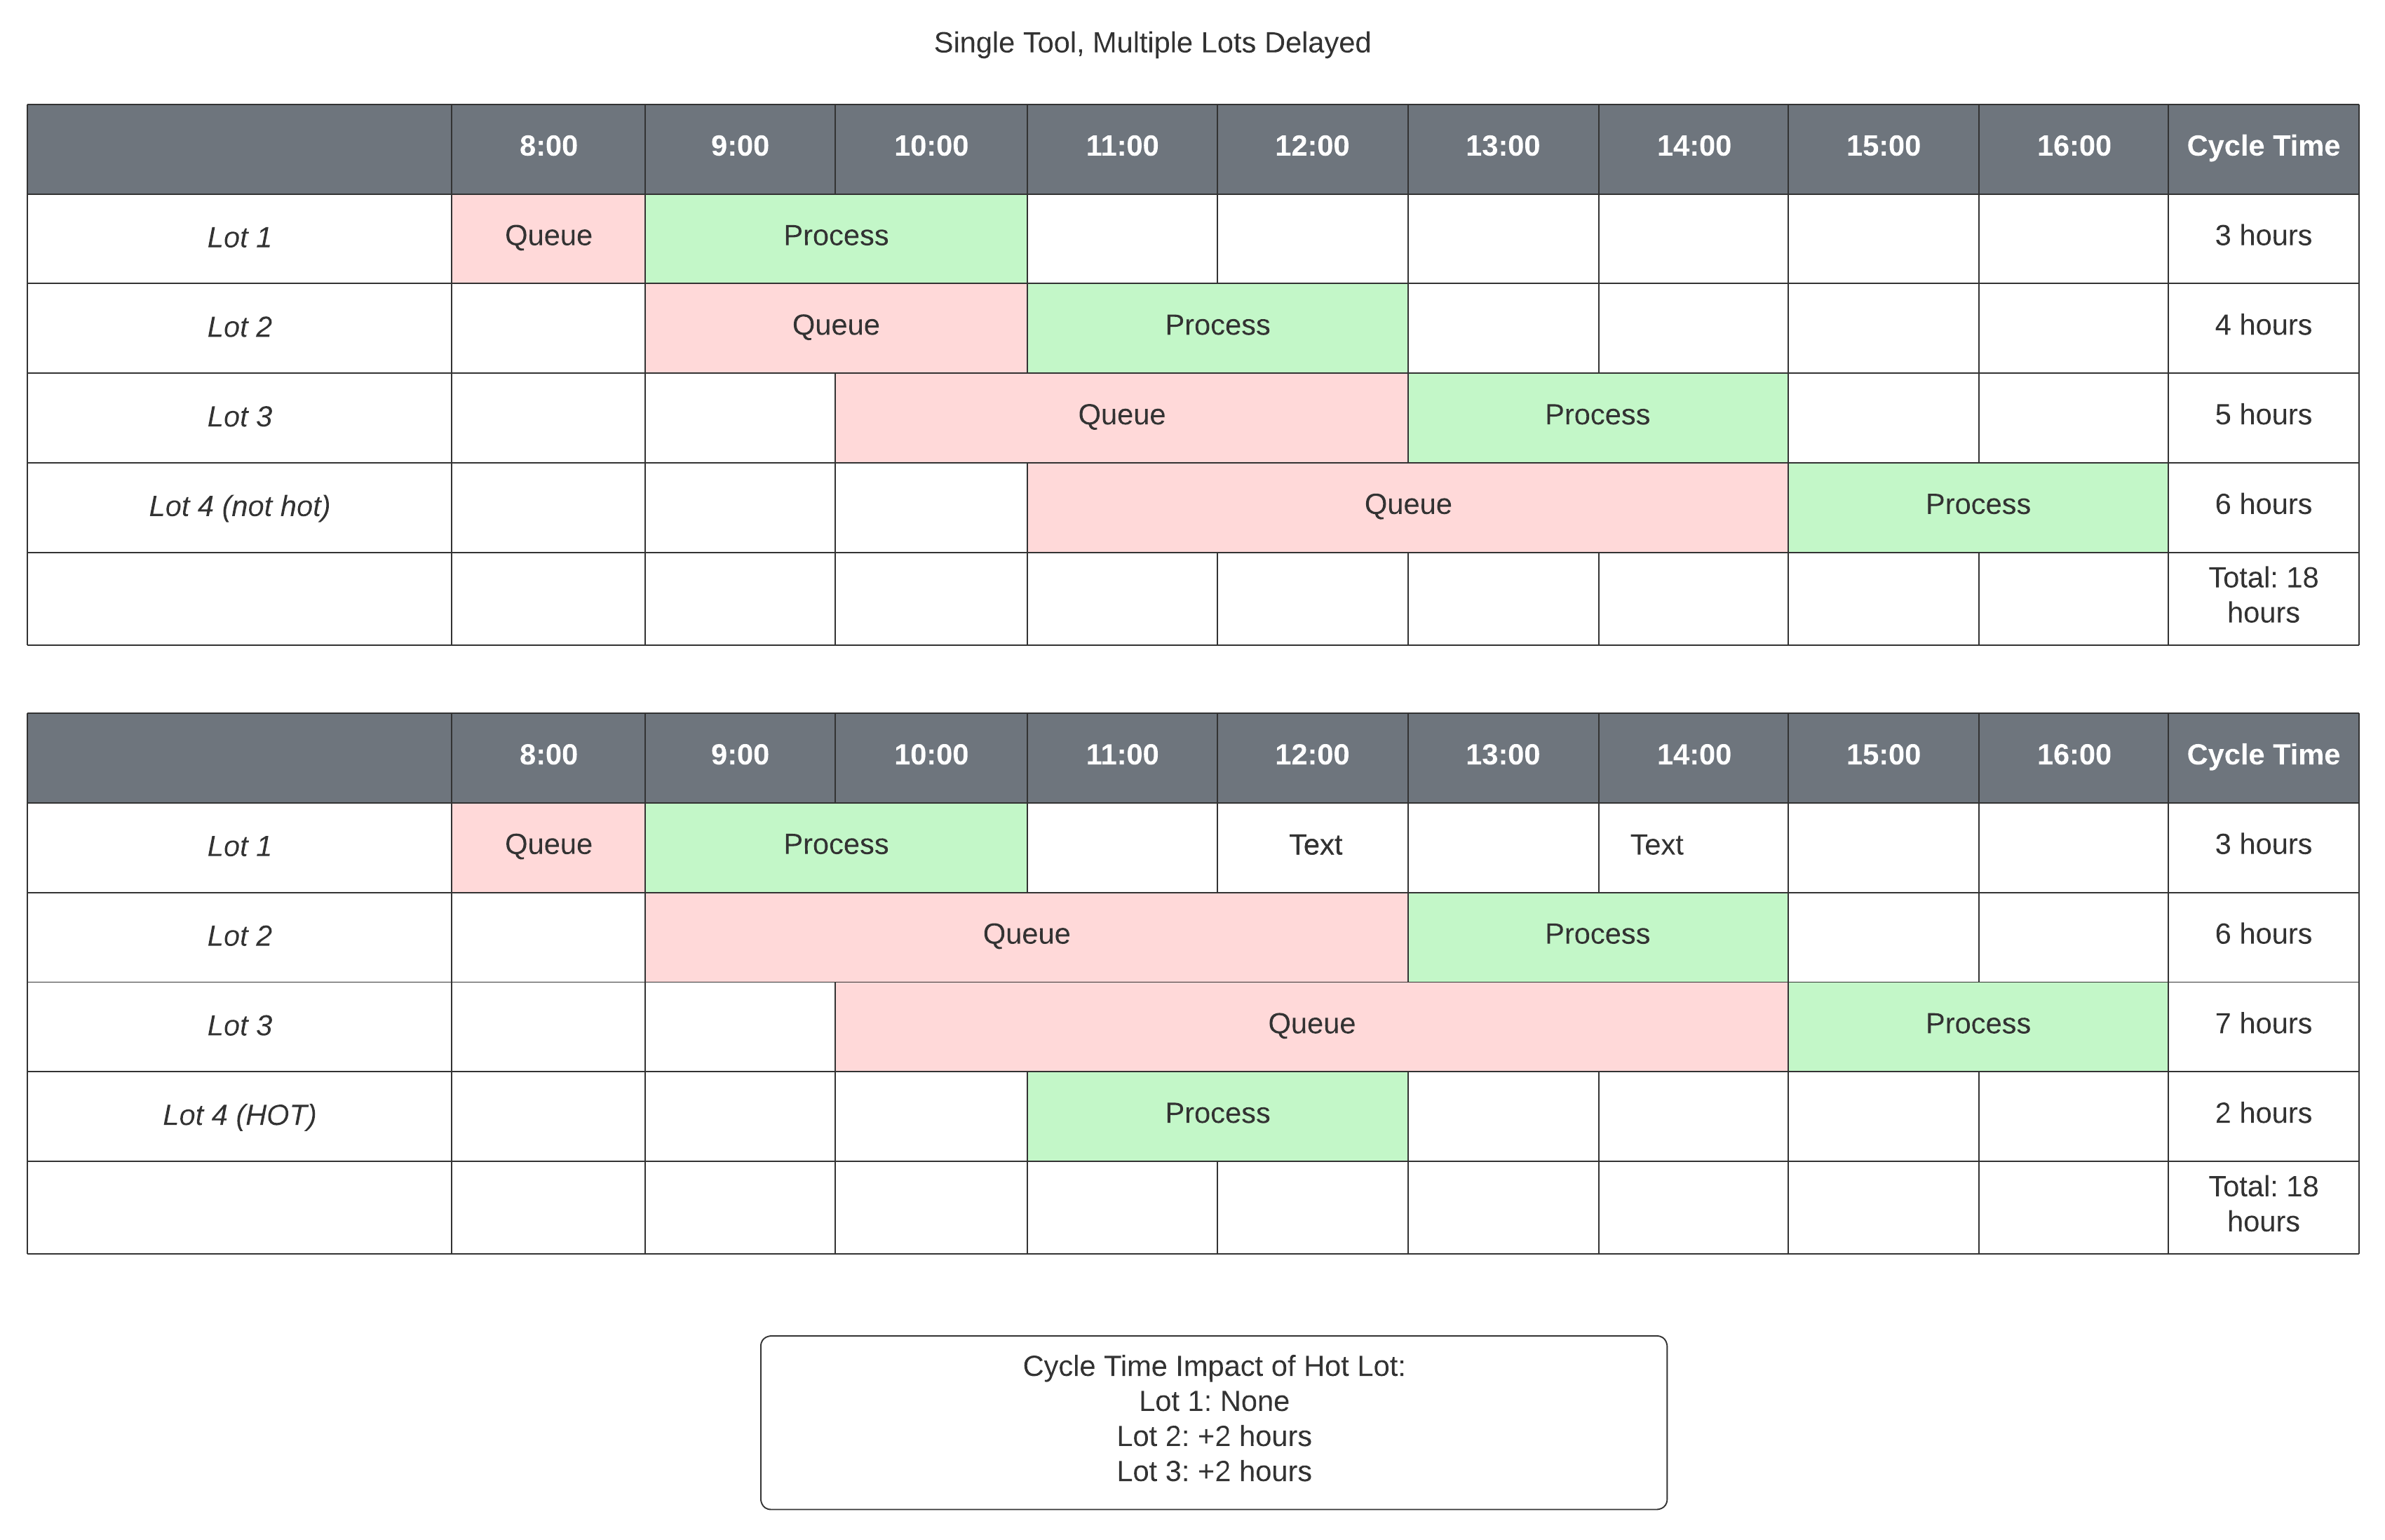
At the bottom of the chart, assume that Lot4 is a hot lot. Lot4 arrives after Lot2 and Lot3 are already in queue, just as Lot1 is completing processing. Lot4 is processed immediately, delaying both Lot2 and Lot3. The two-hour process time for Lot4 causes two hours of additional queue time each for Lot2 and Lot3. The total cycle time incurred across all four lots is still 18 hours, but the four hours of queue time that Lot4 would have incurred, if not hot, are divided equally between Lot2 and Lot3.
Example 3: Multiple Tools, Single Lot Delayed
Fair enough. But what happens if there are multiple tools in the tool group? In our third example, shown below, the top scenario shows a sequence of five lots, none of them hot, arriving to a tool group with two tools.
- At 08:00, Lot1 arrives at Step1 (ToolGroup1), but no tools are available.
- At 09:00, Both Tool1 and Tool2 become available. Lot1 begins running on Tool1. Lot2 arrives at Step1 (ToolGroup1) and immediately begins processing on Tool2.
- At 10:00, Lot3, Lot4, and Lot5 all arrive at Step1 (ToolGroup1).
- At 11:00, Lot1 completes running on Tool1 and Lot2 completes running on Tool2. Lot3 begins running on Tool1 and Lot4 on Tool2. Lot5 (non-hot in this scenario) waits in queue.
- At 13:00, Lot3 completes running on Tool1. Lot4 completes running on Tool2. Lot5 begins running on Tool1.
- At 15:00, Lot5 completes running on Tool1.
- The total cycle time for the five lots is 16 hours (3.2 hours/lot).

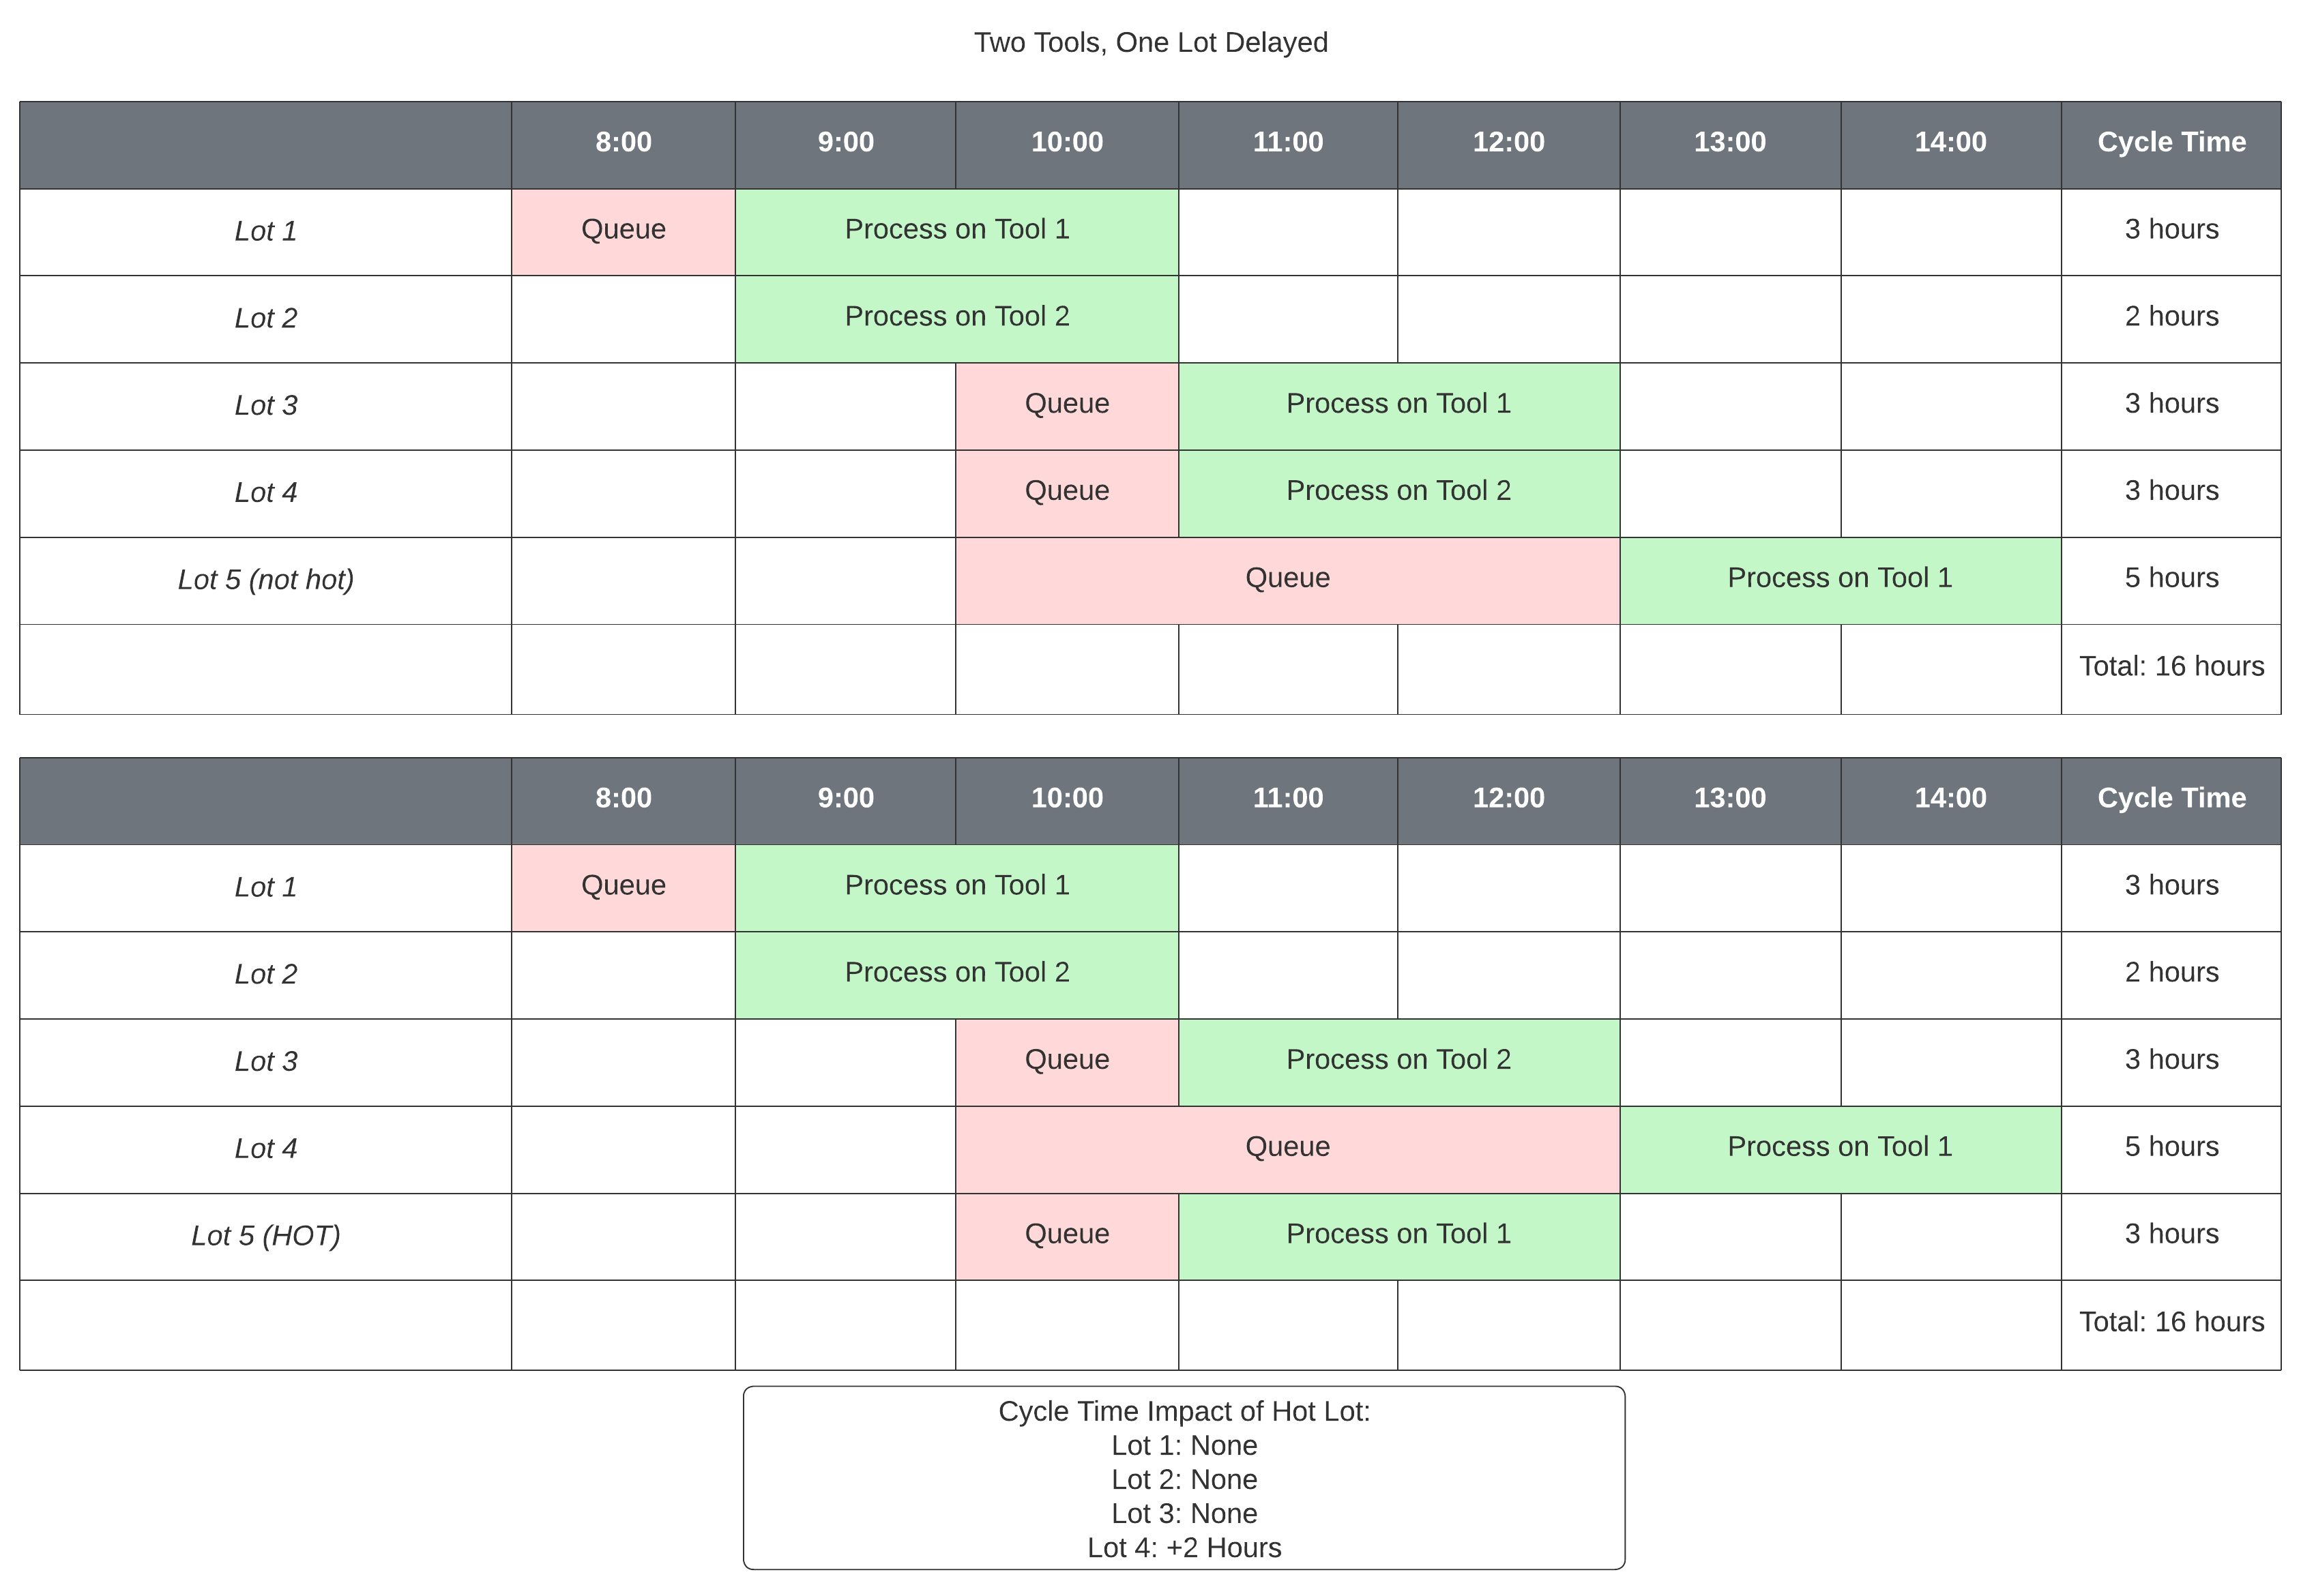
At the bottom of the chart, everything is the same except that Lot5 is hot. Nothing changes until 11:00, when Tool1 becomes available, and Lot5 jumps ahead of Lot4 to be processed. Lot4’s cycle time increases by Lot5’s two-hour process time to five hours, while Lot5’s cycle time decreases to three hours. The total cycle time remains 16 hours. The calculation of hot lot cycle time impact is done the same way as in the single tool case, by looking at the delta between the hot lot begin run (11:00) and the subsequent begin run of the lot displaced by the hot lot (Lot4’s begin run at 13:00).
Example 4: Multiple Tools, Multiple Lots Delayed
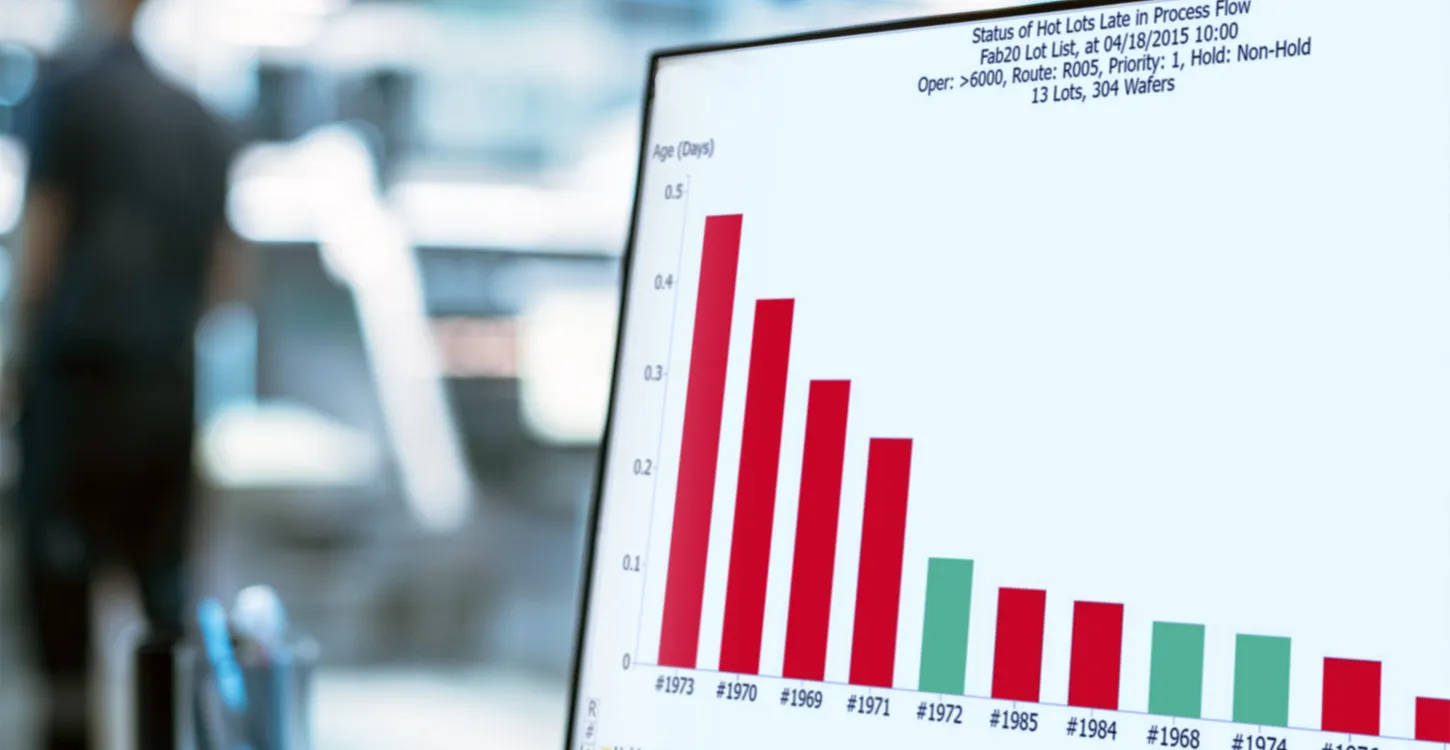
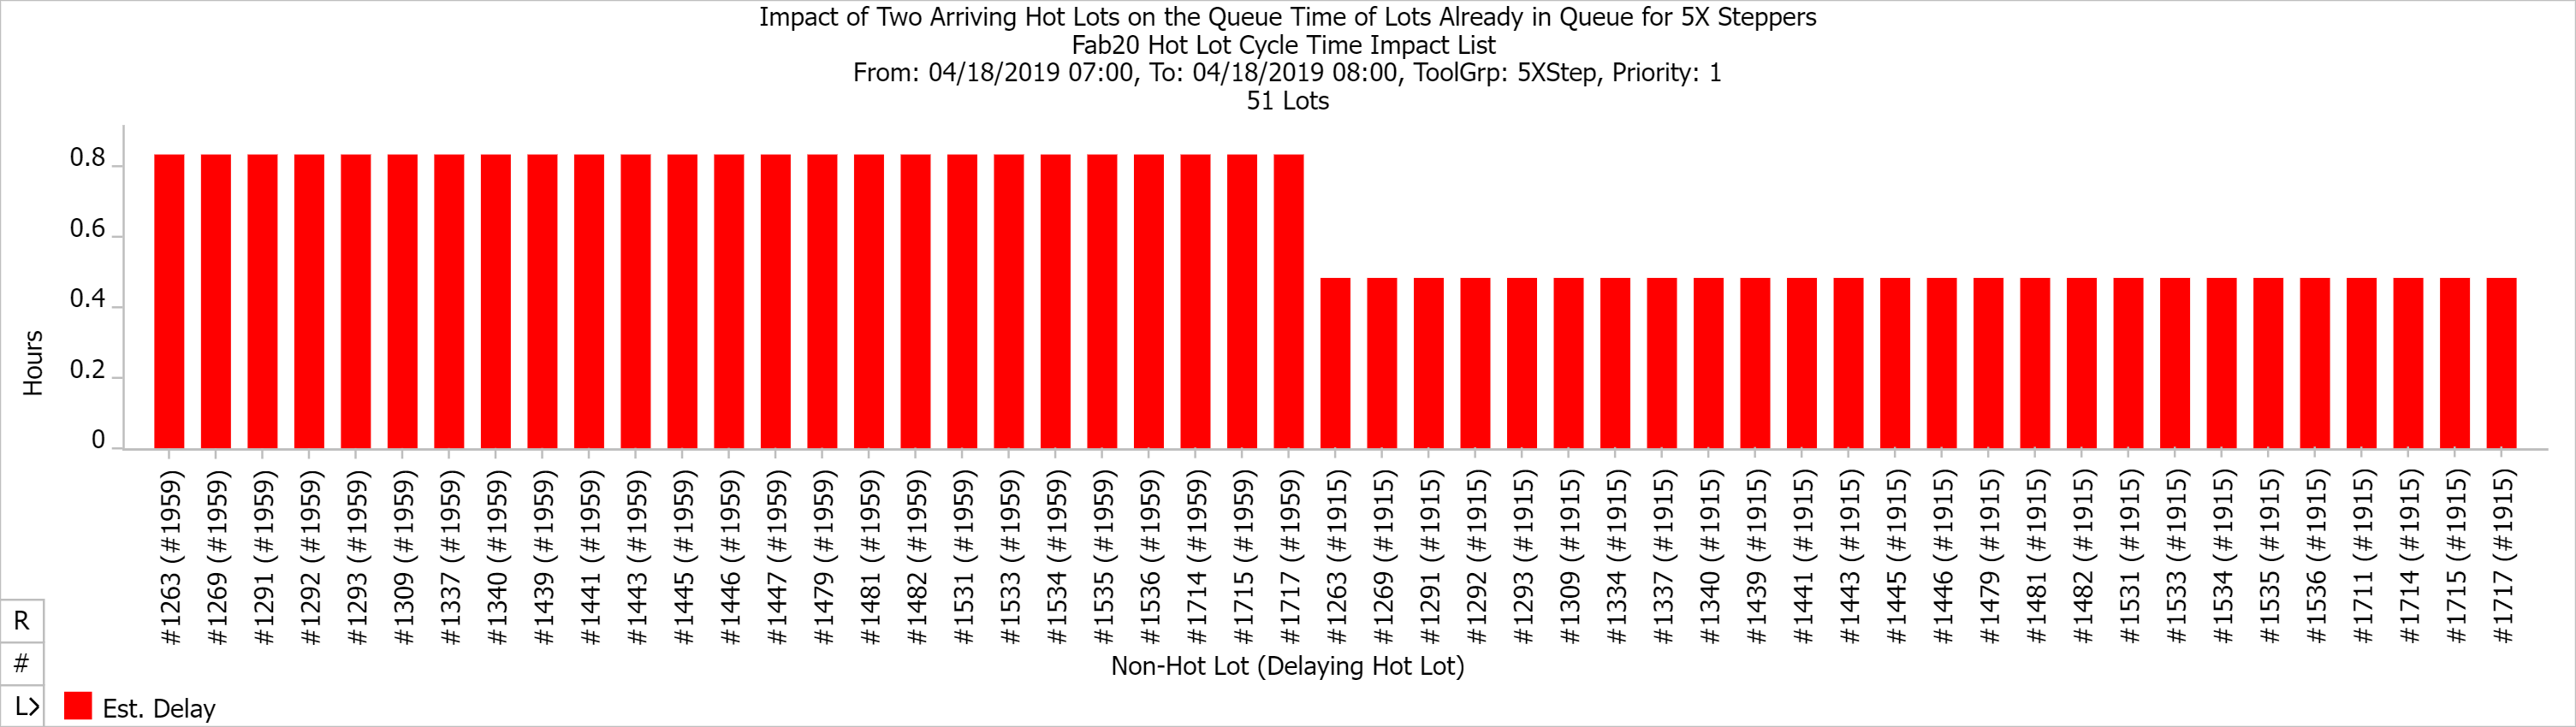
The chart below, from the FabTime reporting software, shows another example. In this case, two hot lots arrive at the 5x Stepper tool group during the one-hour time period of the chart. Each of these lots jumps the queue and delays the roughly 25 lots already in queue by the hot lot process time (~0.8 hours for the first lot and ~0.5 hours for the second lot). It’s tempting to look at this example, with so many lots already in queue, and think that the hot lot delay should be averaged across the other lots, rather than incurred for each lot. But consider: if each of these two hot lots had not jumped the queue, every lot already in queue when they arrived would have been processed 0.8 + 0.5 hours sooner. The extra queue time applies to each lot, not to the lots on average, just as it did in Example 2 above.

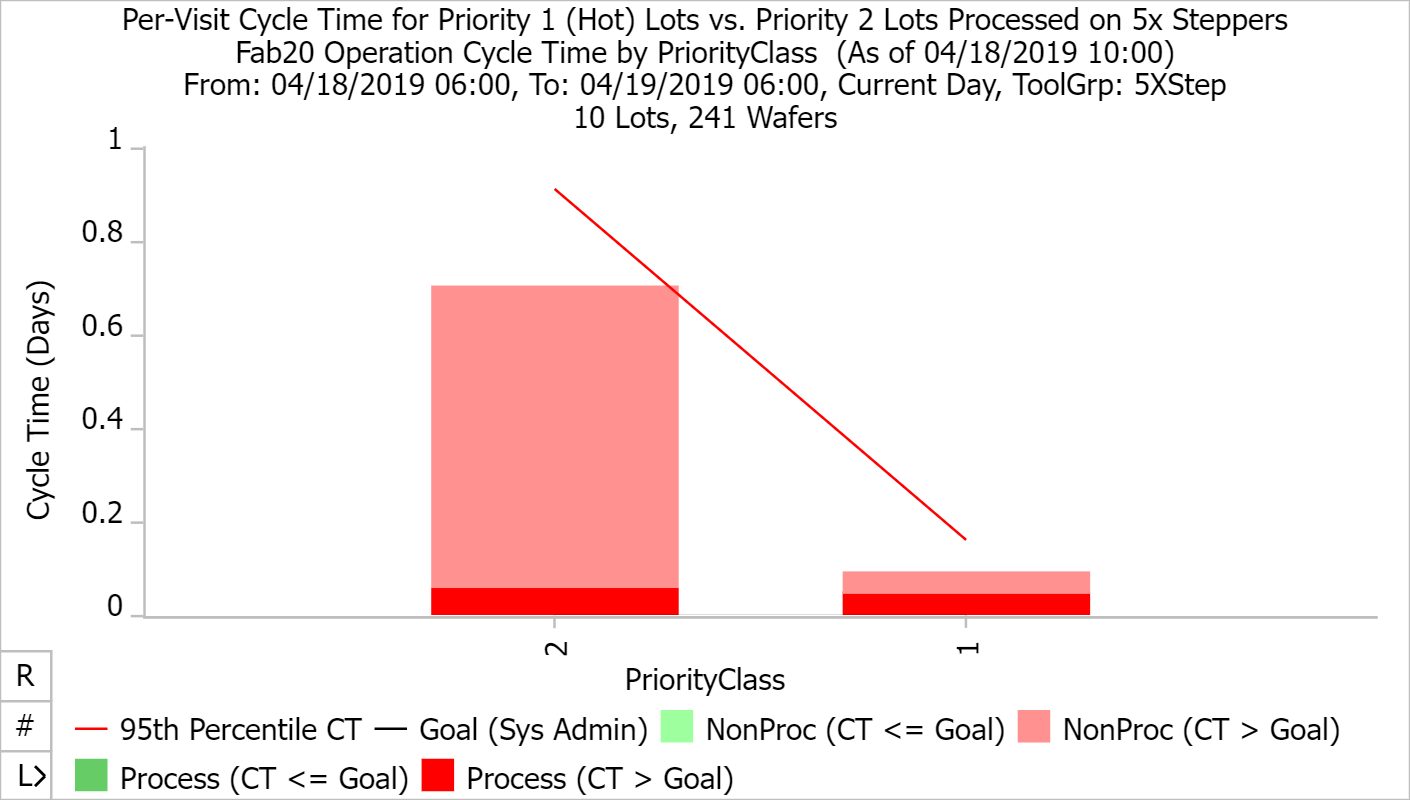
The chart below shows the average cycle time per visit through the 5x Stepper tool group, broken out by Priority 1 (hot) lots and Priority 2 (non-hot) lots. The Priority 1 lots incur only a tiny bit of queue time (the light red), primarily due to waiting for other hot lots, while the Priority 2 lots incur considerable queue time (some of it spent waiting for those Priority 1 lots).


Conclusions
Hot lots remain common in wafer fabs. Every fab we speak with has at least a few hot lots. The reason for this is that it’s not cost-effective to lower a fab’s utilization to the point that the overall average cycle time is very low. Instead, it makes economic sense to treat some small portion of WIP as hot, so that these lots can be processed at a lower cycle time (R&D lots, lots for key customers, etc.).
When there is a small percentage of front-of-the-line hot lots, the impact of the hot lots on the regular lot cycle time is relatively small (basically amounting at the tool level to adding the hot lot process time to the cycle time of each non-hot lot that was waiting when the hot lot arrived). The problem is that the percentage of hot lots can creep up over time. As the hot lot percentage gets higher, the impact on the regular lots is greater, and the resulting regular lot cycle times can become unacceptable.
It can be difficult to understand the contribution of the hot lots to this increased cycle time if it can’t be clearly seen in the data. The Hot Lot Cycle Time Impact metric is intended to show people running the fab how hot lots drive up cycle time for many other lots. In Example 4 above, all 25 lots in queue incur the additional cycle time from the two hot lots that arrive. Such effects cascade through the fab, since hot lots are usually prioritized at every operation. We feel that this Hot Lot Cycle Time Impact metric is a valuable educational tool for fabs, and we are grateful to our prospective customer for having suggested it.

